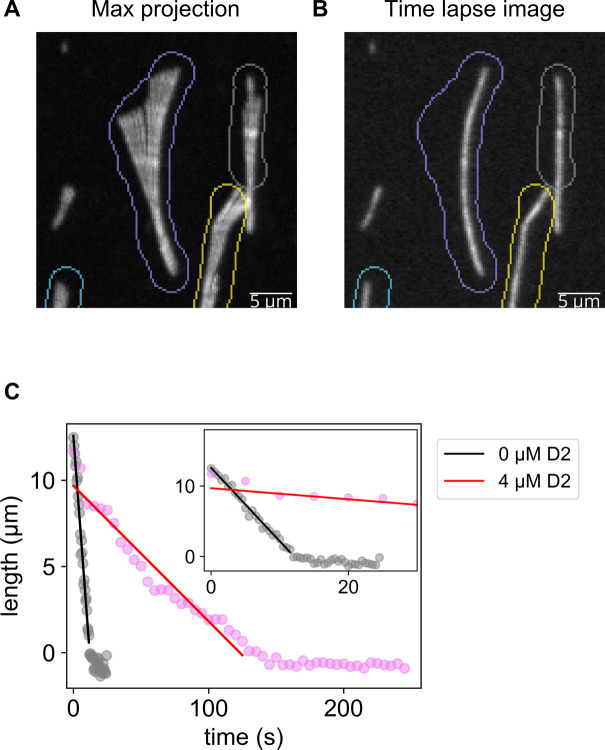
Figure S3. Quantification of the depolymerization rate of microtubules that were shaking during the image acquisition.
(A) Image labels that enclose a microtubule were manually drawn. Colored pixels are the contours of labels. Different colors indicate different labels. (B) Overlay of the label contour and time lapse image at t = 0. (C) Representative plots of the microtubule length against the imaging time and corresponding results of the linear regression. Length was calculated by associating the fluorescence intensity and microtubule length at t = 0.

