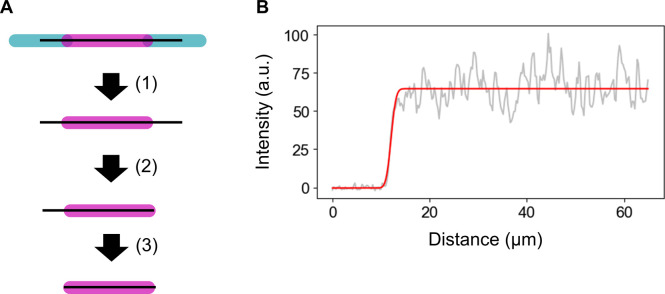
Figure S5. Illustration of the measurement of microtubule length.
(A) Microtubule center line was determined from the total intensity, and the length of the Cy5-labeled microtubule was calculated by fitting the line profile to the error function on each tip. (B) Example of fitting the error function to data for one tip.

