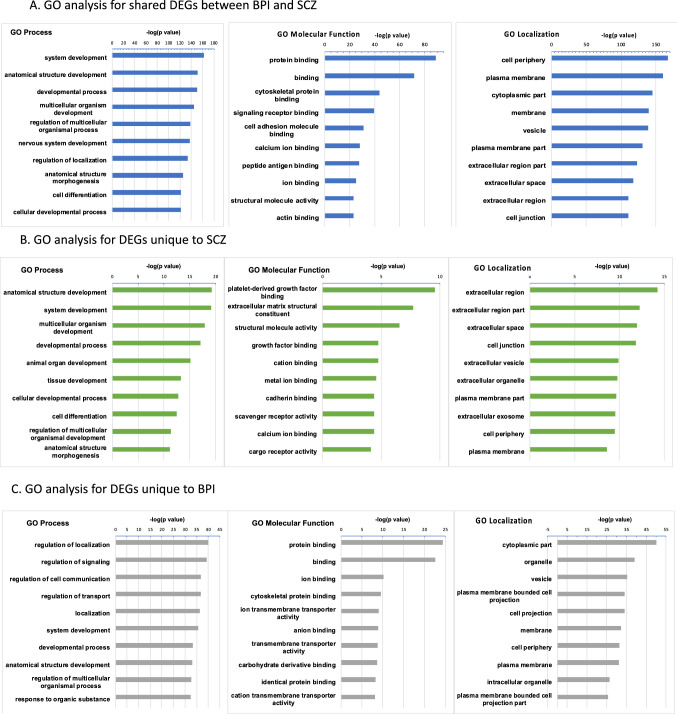
Fig. 2.
Gene ontology analysis. A GO analysis of biological process, molecular function and cellular component/protein localization for DEGs that were shared between SCZ and BPI cerebral organoids when compared to CON cerebral organoids, rank-ordered according to significance (p value) for the top 10 categories. B GO analysis of biological process, molecular function and cellular component/protein localization for DEGs that were unique to SCZ cerebral organoids, rank-ordered according to significance (p value) for the top 10 categories. C GO analysis of biological process, molecular function and cellular component/protein localization for DEGs that were unique to BPI, rank-ordered according to significance (p value) for the top 10 categories

