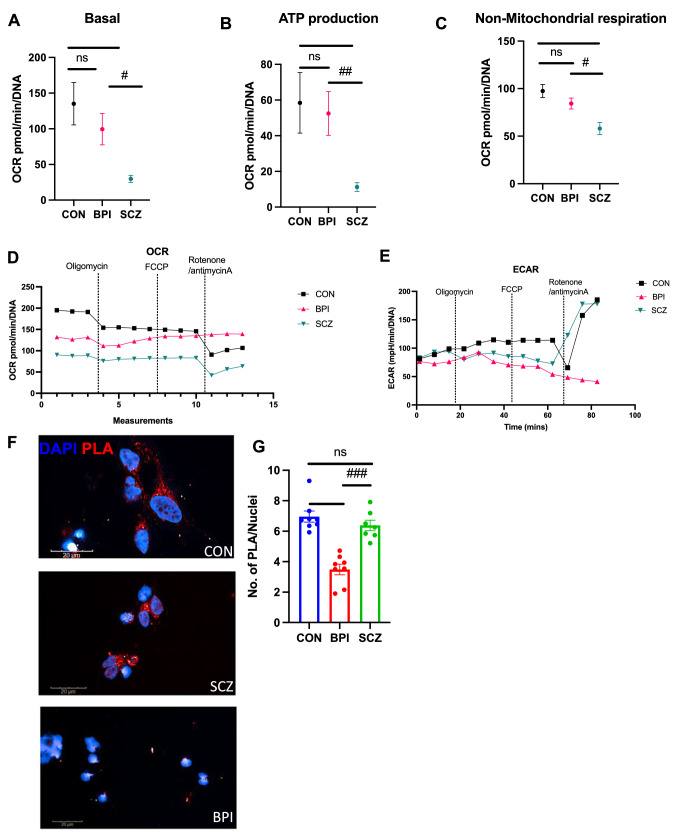
Fig. 3.
Functional analysis of mitochondrial respiration in iPSC-derived cerebral organoids and mitochondrial-ER interactions in iPSC-derived cortical neurons. A–C Seahorse Cell Mito Stress Test assay conducted with 9-month-old cerebral organoids. Data collected from cerebral organoids differentiated from eight BPI iPSC lines and compared with data from SCZ and CON organoids reported previously [20]. Oxygen consumption rate (OCR) results for basal rate, ATP production, and non-mitochondrial oxygen consumption rate are shown, along with values for extracellular acidification rate (ECAR). Data collected from three sections in each condition and values shown as mean ± SEM. Normality was tested via Kolmogorov–Smirnov, but since all data were not normally distributed, Mann–Whitney test was performed. Basal: CON vs SCZ ***p = 0.0001, SCZ vs BPI #p = 0.0249. ATP production: CON vs SCZ **p = 0.0012, SCZ vs BPI ##p = 0.0016. Non-mitochondrial oxygen consumption rate: CON vs SCZ **p = 0.0003, SCZ vs BPI #p = 0.0237. CON vs BPI was insignificant in all categories. D Mitochondrial OCR (oxygen consumption rate) graph. Šídák's multiple comparisons test: CON vs SCZ ***p = 0.0001, CON vs BPI p = ns, SCZ vs BPI ***p = 0.0001. E ECAR (extracellular acid reflux rate) graph. Šídák's multiple comparisons test, performed CON vs SCZ, p = ns, CON vs BPI ***p = , CON vs BPI ***p = 0.0010 and SCZ vs BPI *p = 0.0102. F Representative images of proximity ligation assay (PLA) in CON, SCZ and BPI cortical neurons. Scale bar: 20 μM. F Quantification of PLA positive objects/nuclei. Data shown from cortical neurons generated from eight SCZ iPSC lines and compared with PLA data from eight CON and eight BPI iPSC lines reported previously [21]. Values are shown as mean ± SEM. Two-tailed Mann–Whitney U test: CON vs BPI ***p = 0.0002, SCZ vs BPI ###p = 0.0003, CON vs SCZ was insignificant

