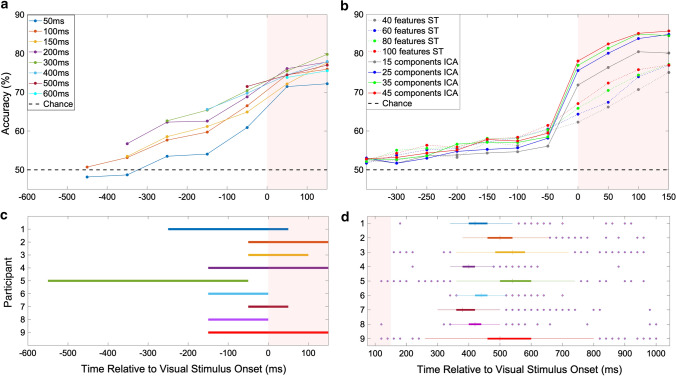
Fig. 2.
Time window analysis and movement onsets. a Function of classification accuracy with respect to data window position and length. Prediction accuracy is averaged over the group of 9 participants, the position of the data point on the x-axis shows the right-side end of the time window. b Group average classification accuracy for different feature extraction methods (ICA vs. PCA-based spatiotemporal) at different time points, with varying number of features, using a fixed time window 150 ms prior to and including the data point shown. c Optimal time windows for each participant. The horizontal bars represent time windows which produced the highest accuracy in the classification, with all other variables held constant. d Overview of movement onsets across participants, relative to the visual onset of the stimulus, as determined by hand position tracking. The median latency and interquartile range is shown with whiskers extending to the most extreme data points excluding outliers, plotted separately. The shaded pink area in all figures represents the time from the onset of the visual stimulus to 150 ms after the stimulus, which is data still used by the classifier. 21 trials are contained in this area (0.02%)

