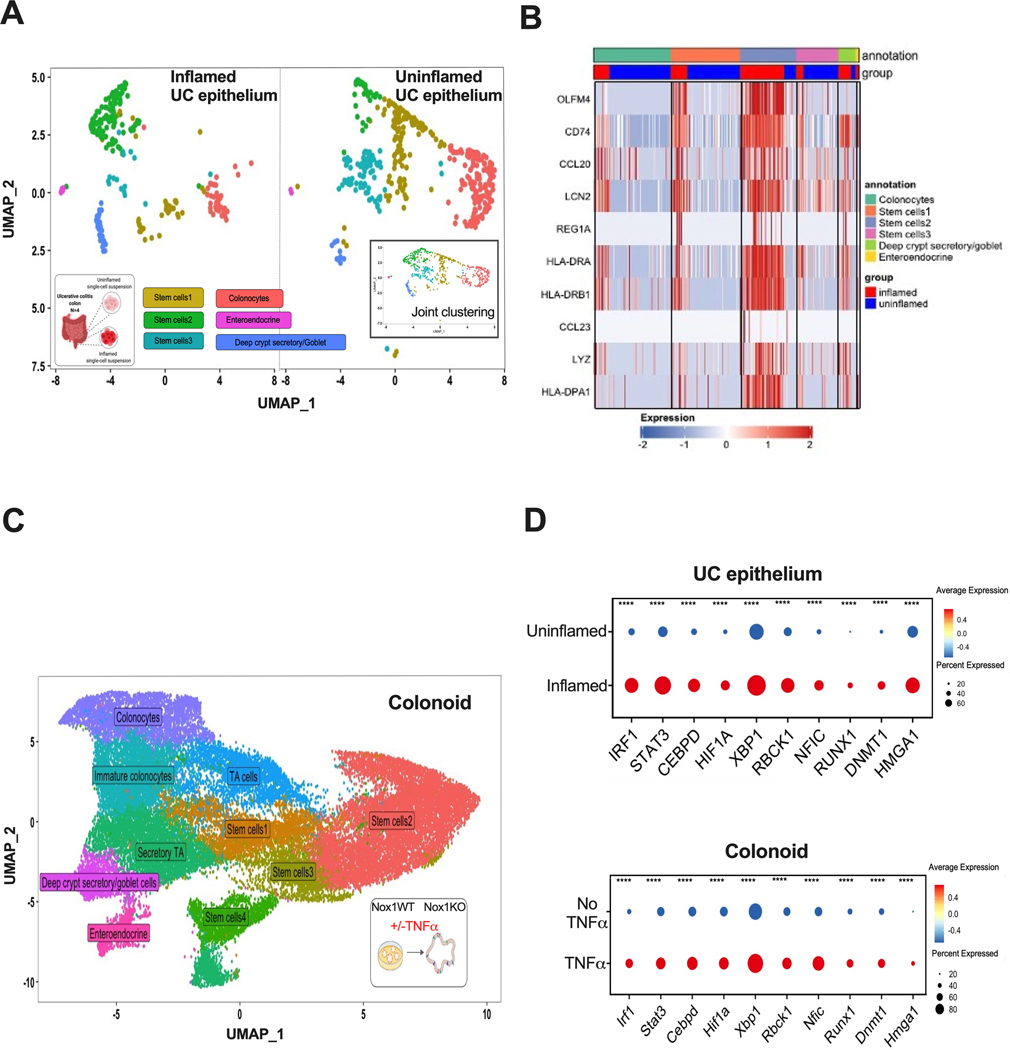
Figure 2. Single cell transcription factor gene expression comparing inflamed vs. uninflamed UC is similar in TNFα-induction in colonoids.
A. UMAP of joint clustering from epithelial cell clusters of UC scRNAseq stratified by inflammation status. The UMAP of the combined inflamed and uninflamed cells are shown in the inserted right panel. N=4 UC patients. B. Heatmap of the top 10 upregulated genes in the stem cell 2 cluster from UC epithelium scRNAseq. Expression is log2 normalized. C. UMAP showing joint clustering of colonoid cells from scRNAseq of untreated and TNFα-stimulated Nox1WT and Nox1KO cultured mice colonoids. D. Dot plots of inflammation or TNFα induced transcription factors in inflamed vs. uninflamed UC epithelial cells (top) similarly upregulated upon TNFα stimulation in colonoids (bottom). ****, P < 0.0001 (two-sided Wilcoxon signed-rank test).

