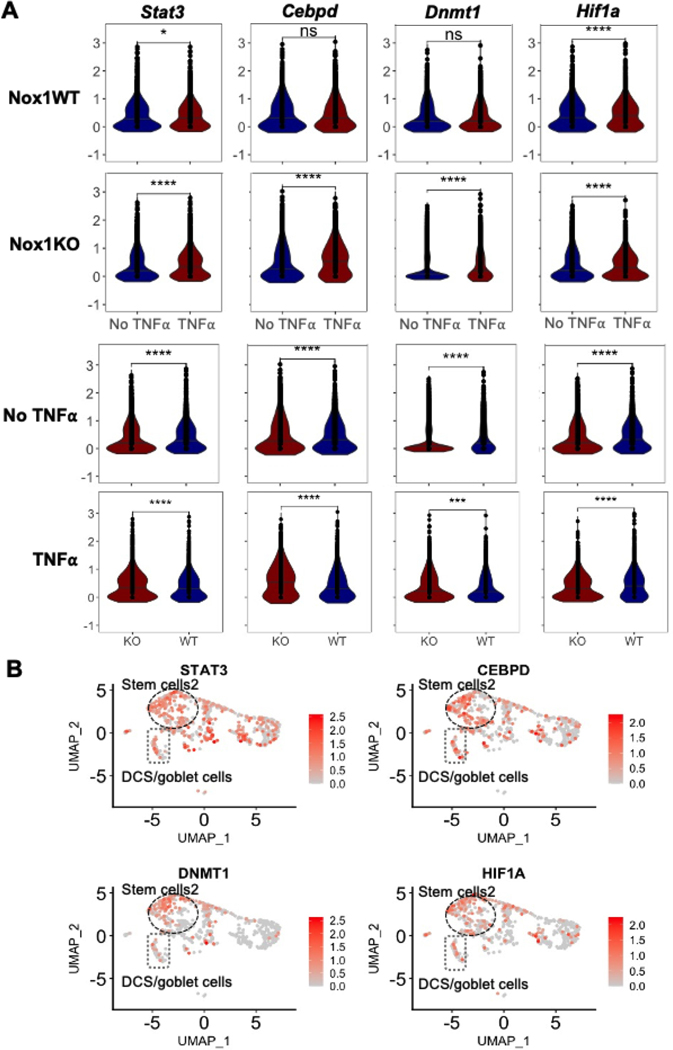
Figure 3. NOX1- and TNFα-modulated transcription factor expression is predominant in UC stem cells.
A. Violin plot of transcription factors showing differential expression in inflamed vs. uninflamed tissue and being differentially expressed (without TNFα) by genotype. TNFα-stimulated differences for Nox1WT (first row) and Nox1KO (second row) colonoids. Genotype dependent differences without (third row) and with (forth row) TNFα stimulation. Ns, non-significant. *, P<0.05. ****, P < 0.0001 (two-sided Wilcoxon signed-rank test). B. Feature plot of induced transcription factors projected onto UMAP from UC epithelial cells (see Figure 2A for cell annotation).

