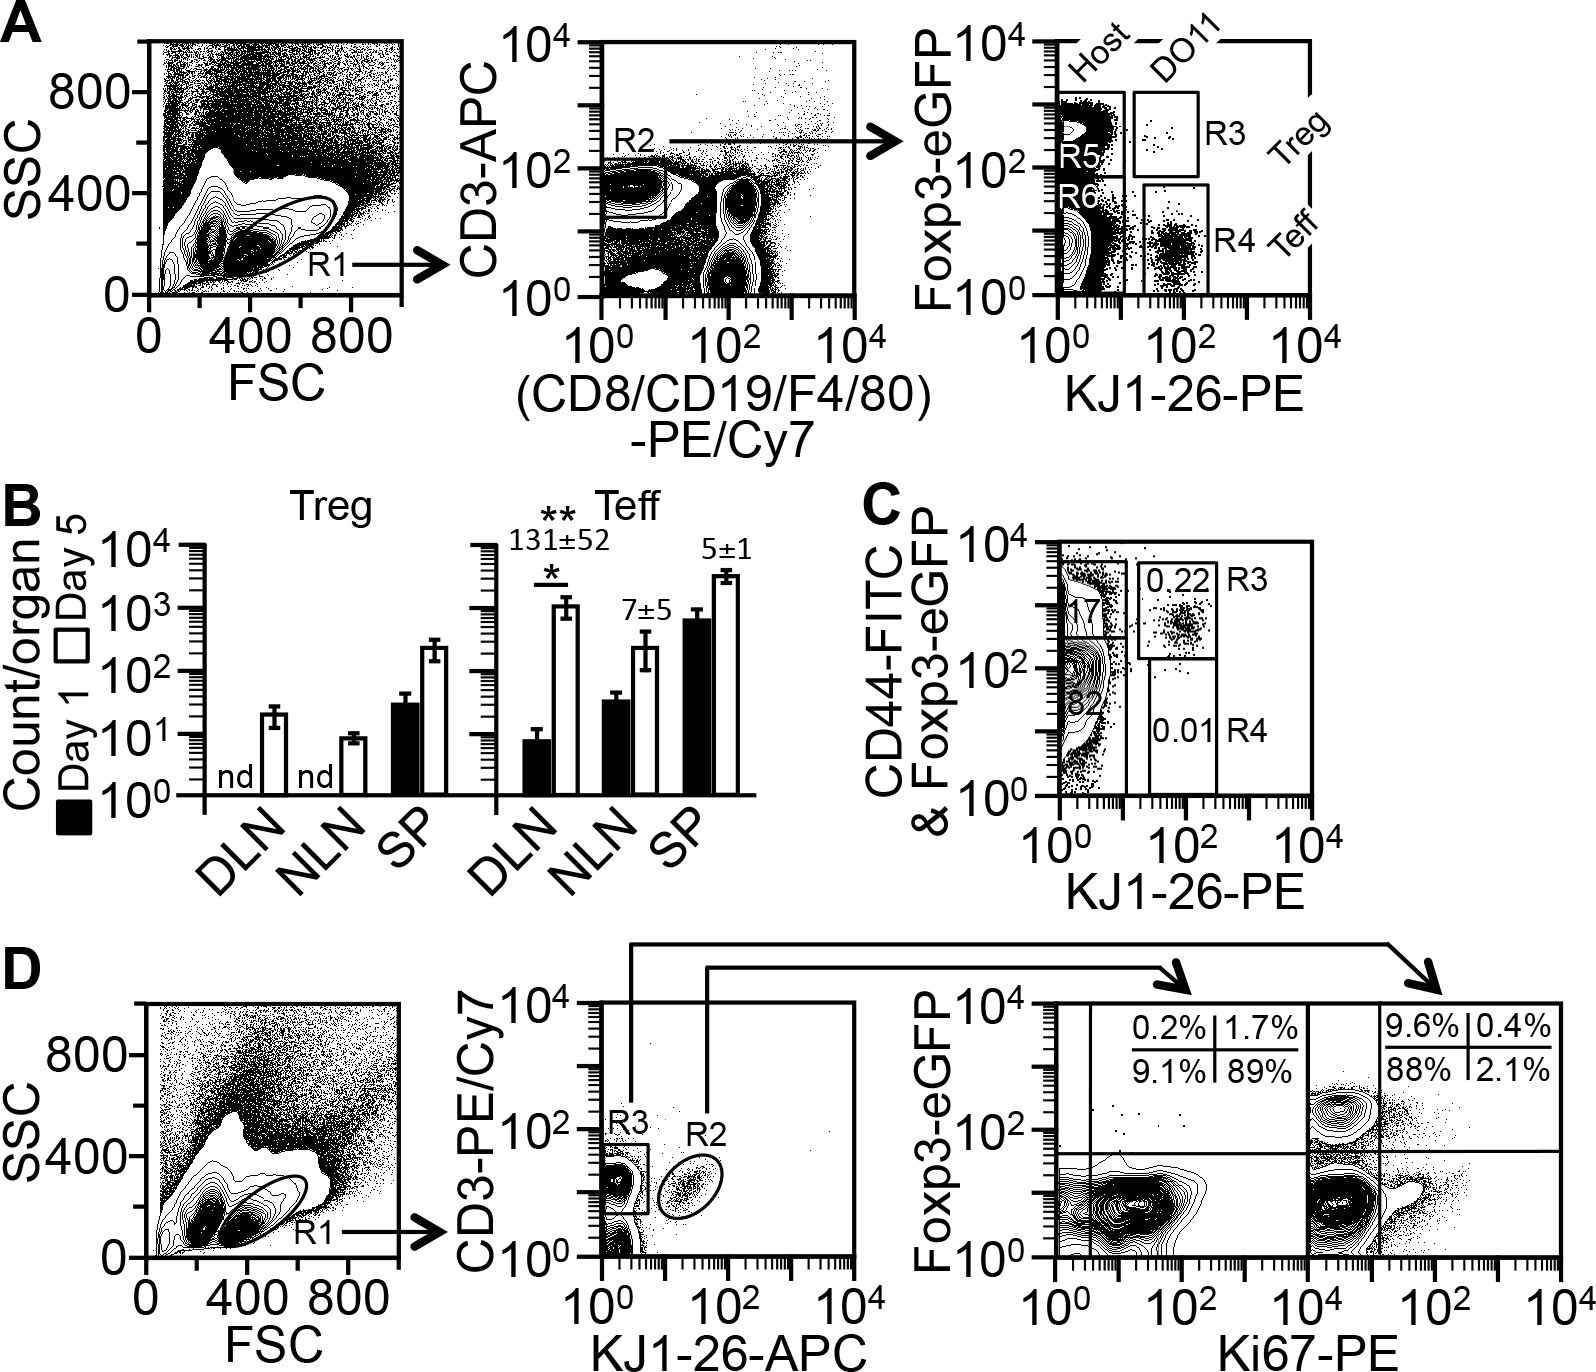
FIGURE 3.

Model for testing tolerogenic adjuvants. (A) Method for detecting TCR-transgenic (“DO11”) Treg (R1*R2*R3), TCR-transgenic Teff (R1*R2*R4), host Treg (R1*R2*R5), and host Teff (R1*R2*R6) cells in the model (see “Analysis of CD4+ T cell counts in the model”). Depicted are the cells from the DLN on day 5. (B) Counts of KJ1-26+ Treg and Teff cells in DLN, non-draining lymph nodes (“NLN”), and the spleen (“SP”) on day 5 versus day 1, as determined by the method in A. Data are mean ± SD of four experiments. Numbers on the top of the bars indicate the fold change in Teff counts since day 1. *p = 0.004 (two-sided t test); **p ≤ 0.0002, for the fold change in DLN versus NLN and SP (one-way ANOVA); nd, not determined due to low counts. (C) Method for CD44 analysis. Cells shown in A were additionally stained with FITC anti-CD44 and analyzed by the method in A. Numbers in the gates indicate percentages of the total CD4+ T cells. The R3 gate contains both KJ1-26+CD44+ Teff cells (FITC+; 0.22%) and KJ1-26+ Treg cells (Foxp3-eGFP+; 0.004%), as determined with an isotype-matched FITC control (not shown). Shown is one of two similar results. (D) Method for detecting Ki67+ Treg and Teff cells (see “Analysis of CD4+ T cell proliferation in the model”). Depicted are the cells from the DLN on day 5. Quadrant plots on the right are drawn based on the locations of the Ki67− subpopulation. Shown is one of two similar results.
