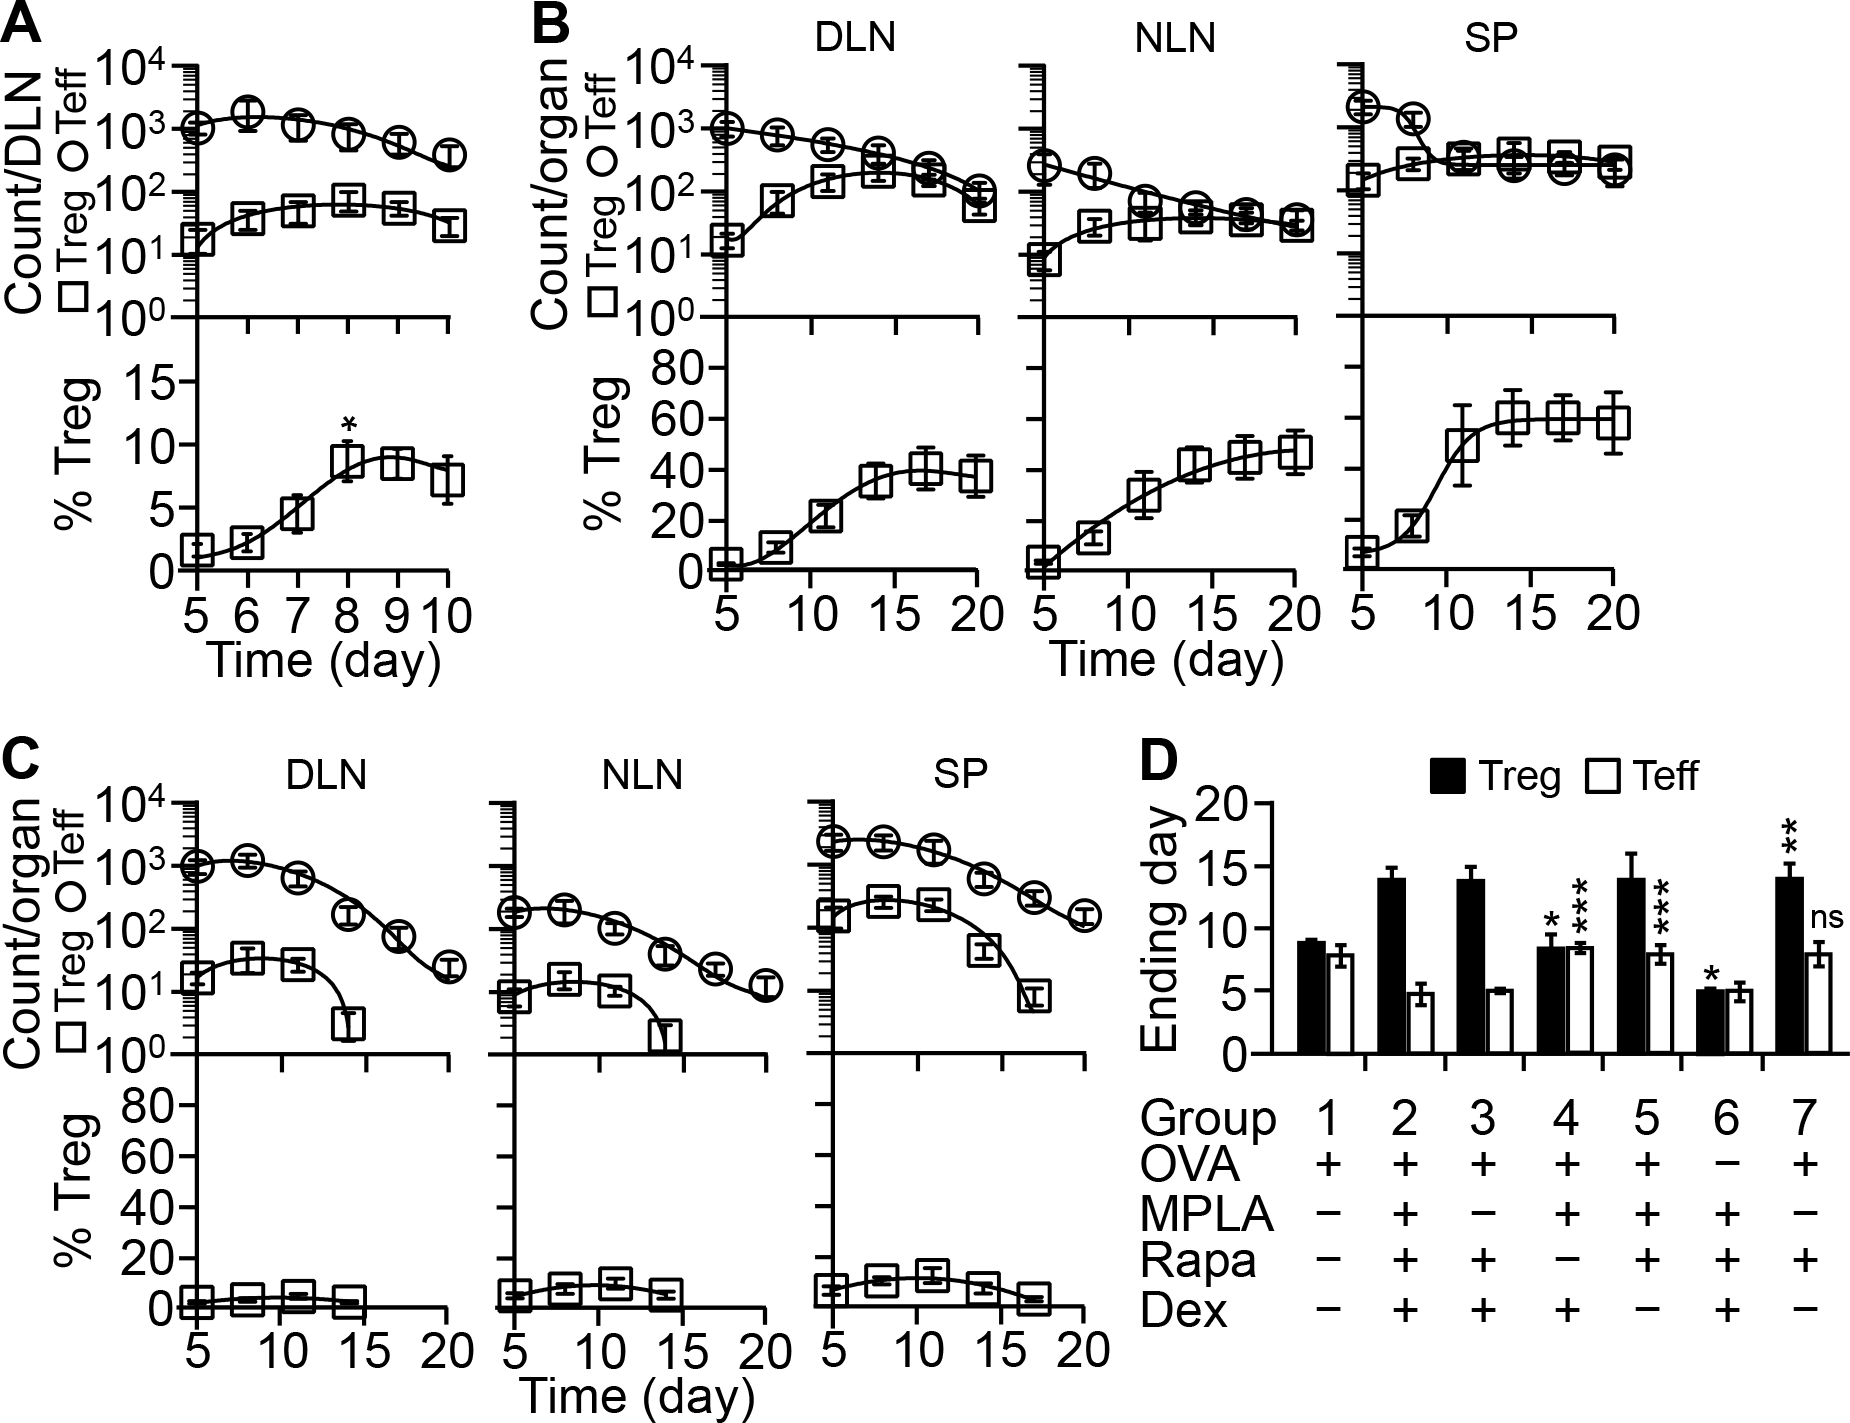
FIGURE 7.

Composition 8203 helps prolong Treg cell expansion. (A) Kinetics after a single injection. The model was injected once on day 5 at the primed footpad with OVA-in-PBS or OVA-in-8203. KJ1-26+ Treg and Teff cells in the DLN were counted daily thereafter. Shown are daily count curves generated by nonlinear regression. Each time point is mean ± SD of four experiments. *p ≤ 0.002, for % Treg on day 8 versus days 5, 6, and 7 (one-way ANOVA). (B&C) Kinetics during repeated injections. The model was injected on day 5 with OVA-in-8203 (B) or OVA-in-PBS (C) once every 3 days. Expansion of KJ1-26+ Treg and Teff cells in indicated organs was followed in the same interval, and cell count curves generated as described in A. Each time point is mean ± SD of four experiments. (D) Role of Ag and each component of 8203 in T cell expansion. The model was injected and analyzed as in B and C. The day when KJ1-26+ T cells in the DLN reached the maximal number is defined as the “Ending day” for cell expansion. Data are mean ± SD of four experiments. *p ≤ 0.001, for Treg cells in groups 4 and 6 versus group 2 (OVA-in-8203); **p ≤ 0.001, for Treg cells in group 7 versus group 1 (OVA-in-PBS); ***p ≤ 0.001, for Teff cells in groups 4 and 5 versus group 2; “ns” (not significant), for Teff cells in group 7 versus group 1 (one-way ANOVA).
