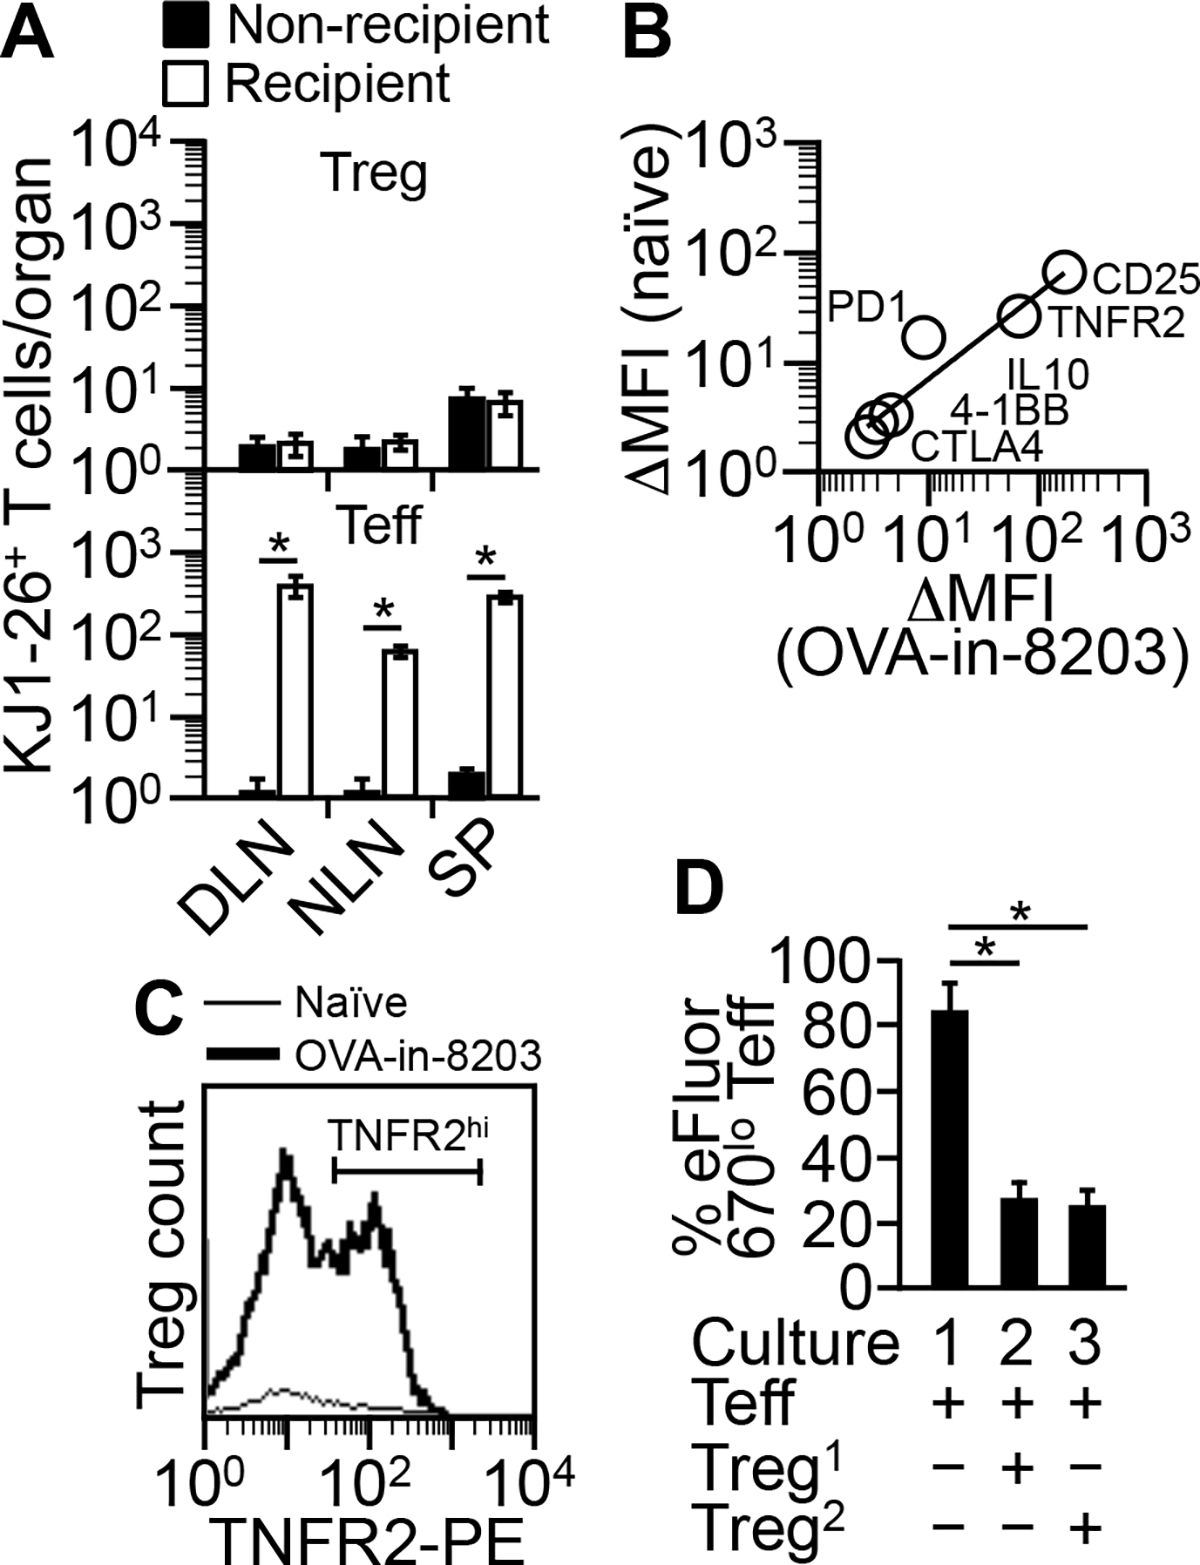
FIGURE 8.

Composition 8203 helps expand nTreg cells. (A) Expansion of KJ1-26+ Treg cells by OVA-in-8203 requires “source Treg cells.” Mice transfused with pure KJ1-26+ Teff cells (see “Mouse model for testing tolerogenic adjuvants”) (“Recipient”) or with PBS (“Non-recipient) were given the optimal regimen of OVA-in-8203. KJ1-26+ Teff and Treg cells were counted three days after the end of the regimen. Data are mean ± SD of two experiments. *p ≤ 0.05 (one-sided t test). (B) Spearman correlation analysis for expression of nTreg markers. KJ1-26+ Treg cells expanded in the model by the optimal regimen of OVA-in-8203 (“OVA-in-8203”) were compared with the source Treg cells in naïve DO11.10 Foxp3-eGFP mice (“naïve”). ΔMFI = MFI of marker-specific staining − MFI of control Ab staining. Data points are average of two experiments. There was a positive correlation between the OVA-in-8203-expanded and the source Treg cells (Rho = 1, p = 0.0028). Of note, the TNFR2 expression depicted is for the TNFR2+ fraction. (C) Expansion of source Treg cells by OVA-in-8203. DO11.10 Foxp3-eGFP mice were primed and given the optimal regimen of OVA-in-8203 in the same manner as described for the model. Three days after the end of the regimen, Treg cells in the DLN (“OVA-in-8203”) were counted and analyzed for TNFR2 expression. The popliteal lymph nodes from naïve mice (PBS injected; “Naïve”) were used as a control. Shown is one of two similar results. (D) Suppression assay. eFluor 670-stained KJ1-26+ Teff responder cells were co-cultured with naïve KJ1-26+ nTreg cells (“Treg1”) or OVA-in-8203-expanded KJ1-26+ Treg cells (“Treg2”). Data are mean ± SD of two experiments. *p ≤ 0.008 (one-way ANOVA).
