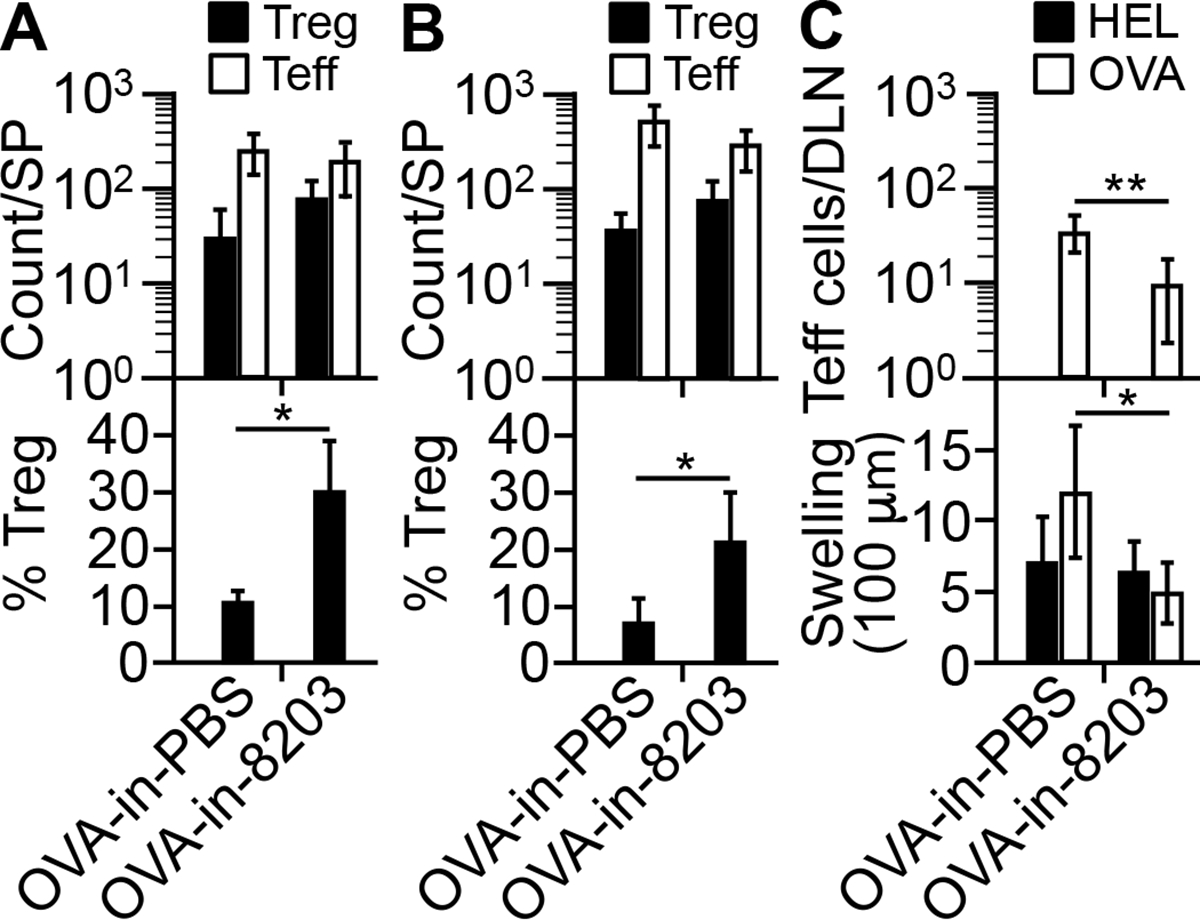
FIGURE 9.

Composition 8203-adjuvanted immunization induces Ag-specific immune suppression. (A) Counts of KJ1-26+ Treg and Teff cells in the spleen (“SP”) of immunized (“OVA-in-8203”) or control immunized (“OVA-in-PBS”) mice immediately before the challenge. Data are mean ± SD of four experiments. *p = 0.009 (two-sided t test). (B) Counts of KJ1-26+ Treg and Teff cells in the SP five days after the challenge. Data are mean ± SD of four experiments. *p = 0.03 (two-sided t test). (C) Teff response to the challenge. Lower: DTH reactions. Data are mean ± SD of 8 mice/group. *p = 0.001 (two-sided t test). Upper: count of KJ1-26+ Teff cells in pooled DLNs five days after the DTH test for OVA. Of note, KJ1-26+ Treg cells were not analyzed due to low counts. Data are mean ± SD of four experiments. **p = 0.001 (two-sided t test).
