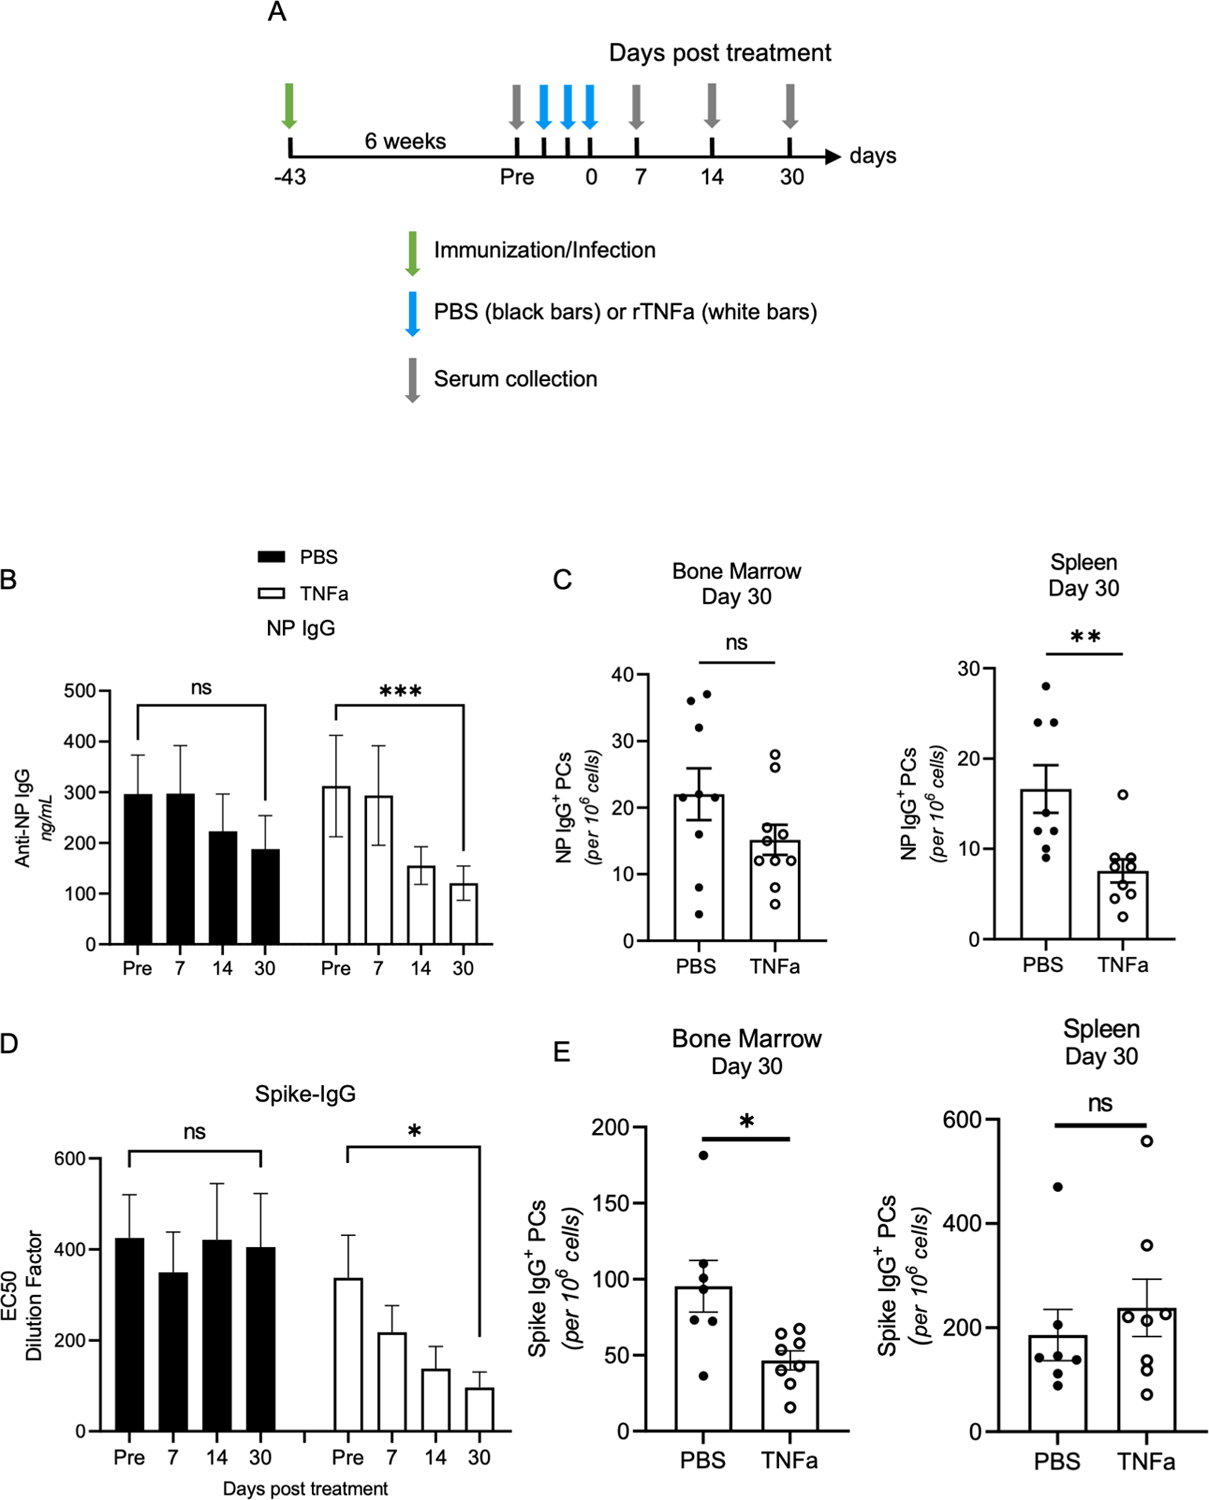
Figure 6. TNFa treatment limits Antigen-specific Antibody titer duration.

(A) Diagram of immunization and infection experiments. PBS (black-filled bars) and TNFa (white-filled bars) treated groups are indicated in each experiment. (B) NP-IgG titers of NP-KLH in alum immunized WT mice were measured by ELISA. Data is representative of two experiments with 5 mice per group. (C) Bone marrow and spleen NP-specific plasma cell quantification was done using ELISPOT. Data is representative of two experiments. (D) Spike IgG titers in vaccinia-infected mice were quantified using ELISA with 8 mice per group. Data is representative of two experiments. (E) Bone marrow and spleen spike-specific plasma cell were quantified using ELISPOT. Data is representative of two experiments. To analyze anti-NP-IgG and anti-spike-IgG titer decay in PBS and TNFa treated groups (B and D), one-way ANOVA and one-phase decay analysis were used. *p<0.05, **p<0.01 and ***p<0.001. (B) PBS T1/2 = 47.52 days and TNFa T1/2 = 26.54 days. PBS T1/2 = not established and TNFa T1/2 = 7.33 days.
