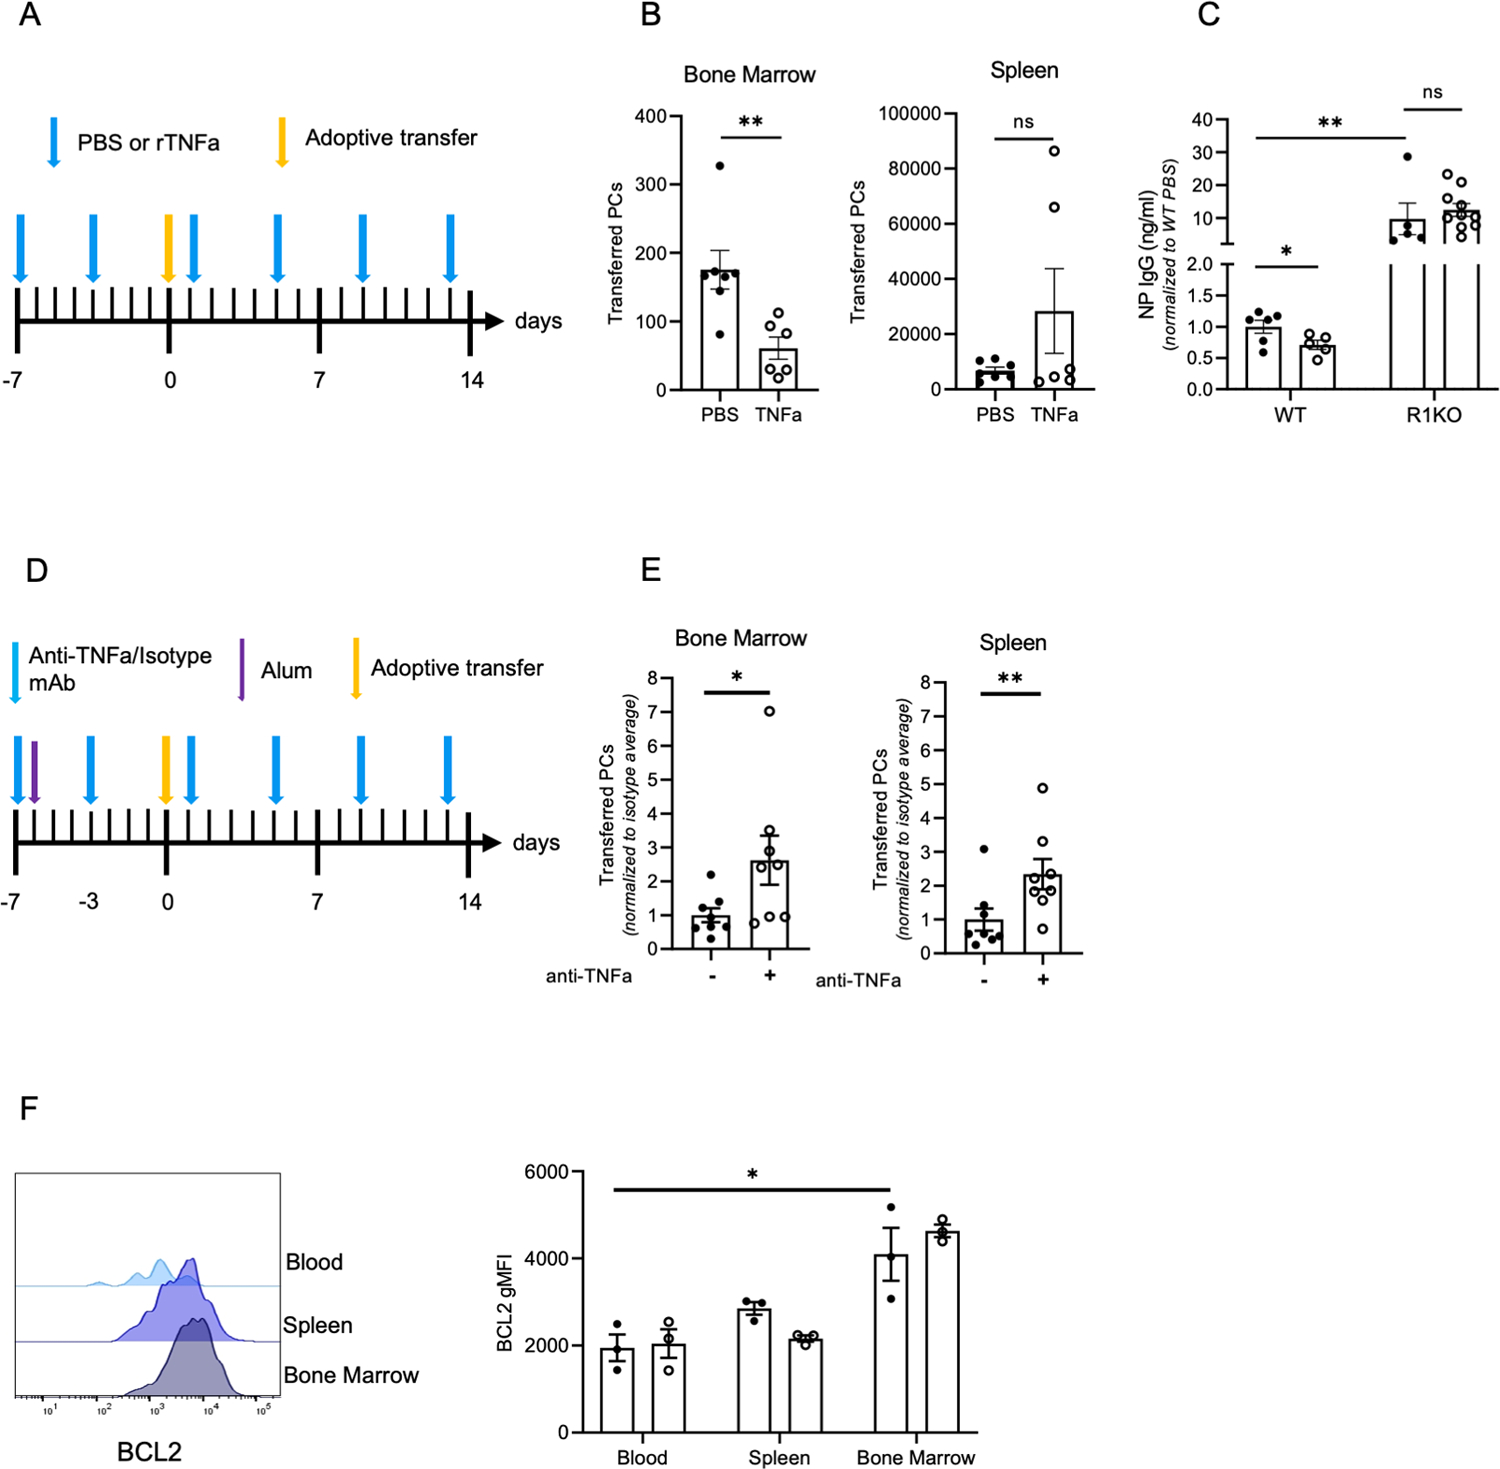
Figure 7. TNFa reduces PC survival and antigen-specific titers by limiting bone marrow retention and engraftment.

(A) Diagram of experimental design for (B-C) using B18-high Blimp-YFP splenocytes for adoptive transfer into PBS and rTNFa treated WT recipients (B) Quantification of transferred ASCs in the bone marrow and spleen of WT recipient mice from (A). Data are from two pooled experiments, with 3–4 mice per group. (C) NP IgG titers of WT and R1KO recipient mice from adoptive transfer experiment depicted in (A). Titers were normalized to WT PBS treated control average. Data are from two pooled experiments with 3–5 mice per group. (D) Diagram of ASC adoptive transfer into anti-TNFa or isotype control treated, alum treated WT recipient mice. (E) Quantification of transferred ASCs in the bone marrow and spleen of recipient WT mice. Transferred ASCs were normalized to the average of the isotype control treated group. Data is representative of two pooled experiments with 3–4 mice per group. (F) BCL2 expression in (CD138high B220low CD3neg YFPhigh) ASCs in the bone marrow, blood, and spleen of PBS and rTNFa treated Blimp-1 YFP mice. Each dot is representative of one mouse. Significance was calculated for adoptive transfer experiments using a student’s T-test. For non-parametric data, a Mann Whitney’s test was performed. *p<0.05, **p<0.01. To quantify the effect of environment and TNFa treatment on YFP ASCs (K), a two-way ANOVA was performed. *p<0.05
