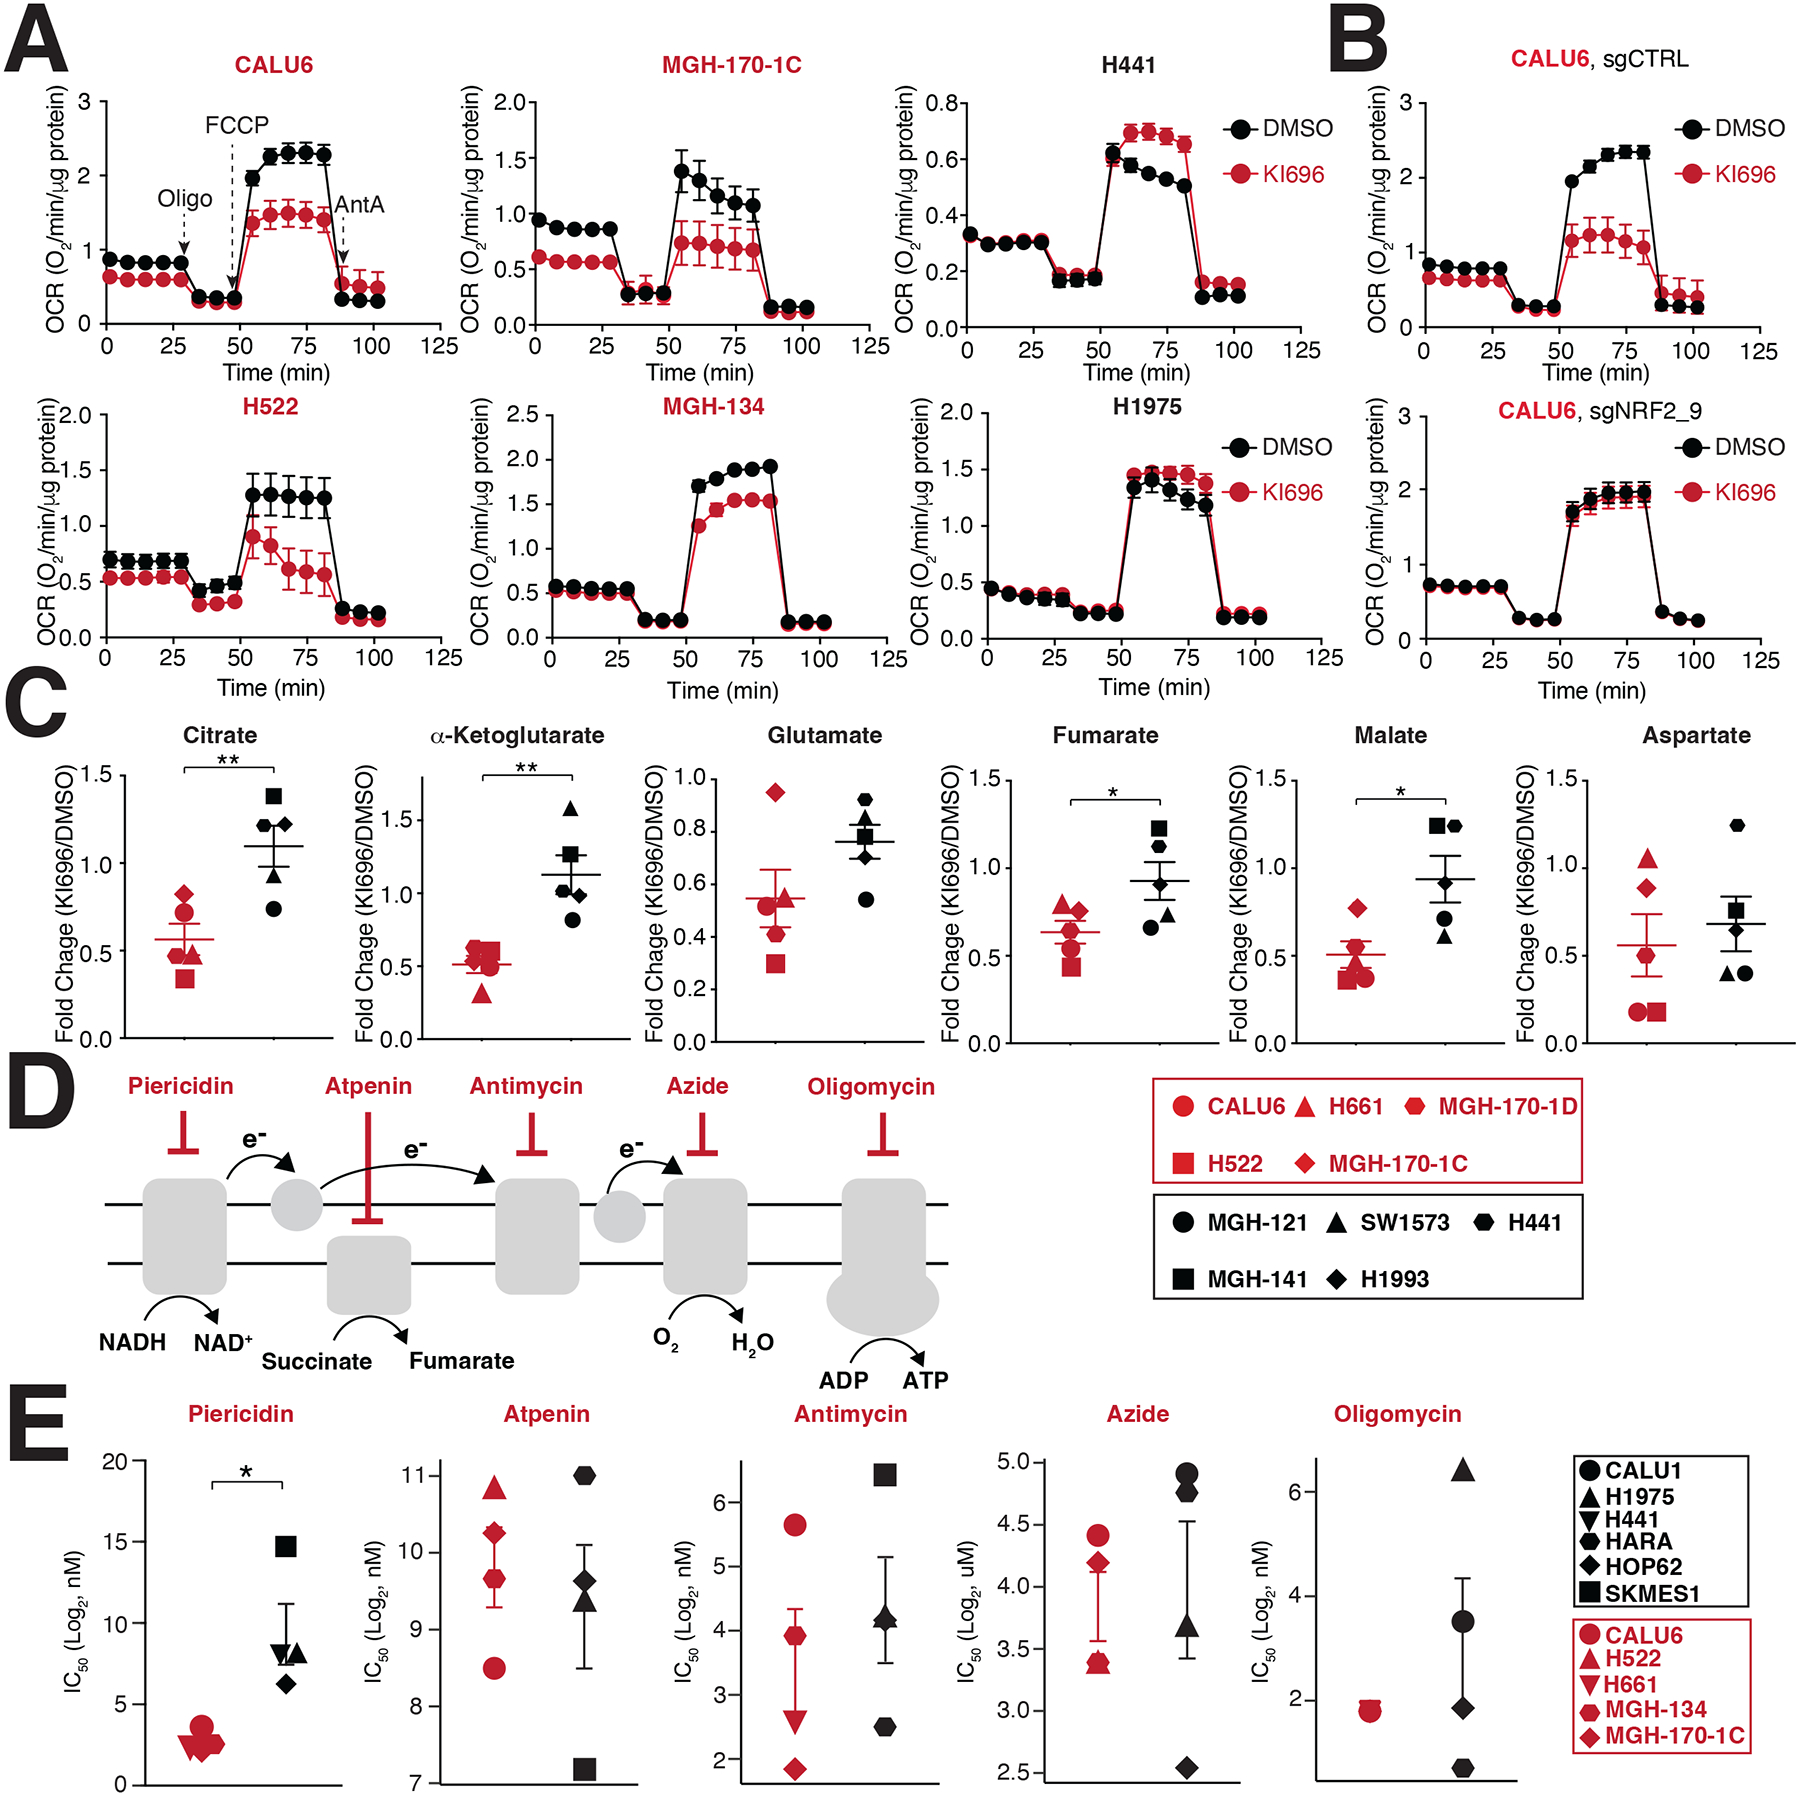
Figure 3: NRF2 activation decreases mitochondrial activity in KEAP1-dependent cells.

(A) NSCLC cell lines were treated with KI696 (1 μM) for 48 hrs and the oxygen consumption rate (OCR) was determined using a Seahorse Bioflux analyzer (Data are represented as a mean ± SEM, n= 6–8 biological replicates). (B) NRF2 regulates OCR in KEAP1-dependent cells. CALU6 cells expressing the indicated sgRNA targeting NRF2 or a control, were treated with KI696 (1 μM) for 48 hrs and OCR was determined as described in (A) (Data are represented as a mean ± SEM, n=6–8 biological replicates). (C) NRF2 activation decreases TCA metabolites in KEAP1-dependent cell lines. NSCLC cell lines were treated with KI696 (1 μM) for 48 hrs and the levels of the indicated metabolites were determined by GCMS (see methods). Fold change (KI696/DMSO) is depicted in the plots (Data are represented as a mean, n= 5 samples per group with 4 biological replicates per sample). (D-E) Complex I inhibition is selectively toxic to KEAP1-dependent cell lines. Schematic of different ETC inhibitors used in this study (D). IC50-values (E) were determined for a panel of NSCLC cell lines (Data are represented as a mean ± SEM, n= 4–5 samples/group measured in 4–6 biological replicates). * indicates p-values < 0.05, ** indicates p-values < 0.01, *** indicates p-values < 0.0001. Statistical significance was determined by Student’s t-test and corrected for multiple hypotheses by False Discovery Rate (FDR), see Methods.
