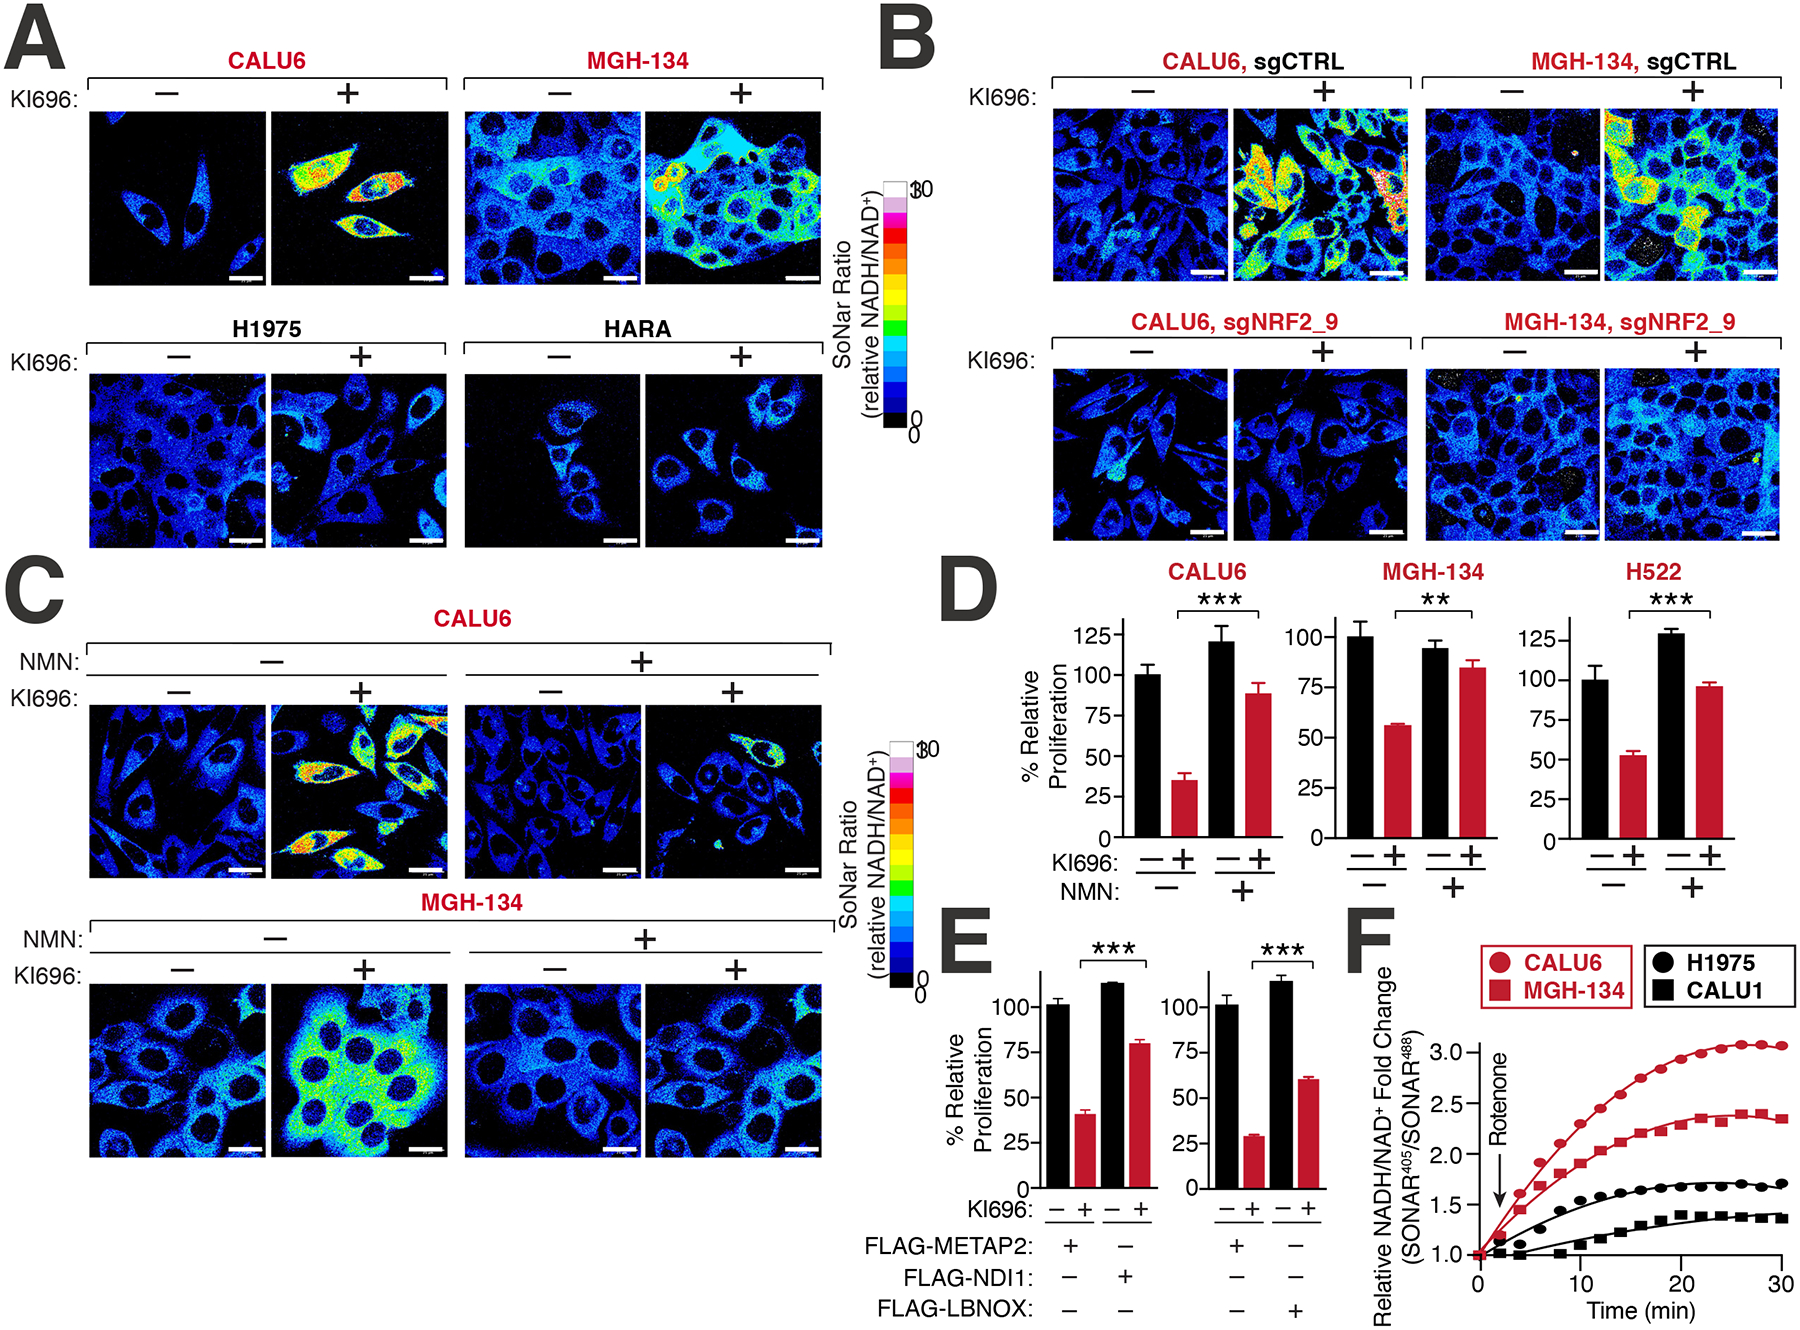
Figure 4: NRF2 induces NADH-reductive stress in KEAP1-dependent cells.

(A) NRF2 activation increases the NADH/NAD+ ratio in KEAP1-dependent but not KEAP1-independent cells. Immunofluorescence analysis of NSCLC cell lines stably expressing the NADH/NAD+ reporter SoNar following treatment with KI696 (1 μM) for 48 hrs. The representative NADH/NAD+ ratiometric image was constructed by taking the ratio of the emission intensity of 405 (NADH binding) vs 488 (NAD+ binding) for SONAR (see also Figures S4D–E). (B) NRF2 depletion rescues KI696-mediated NADH/NAD+ increase. NSCLC cells expressing SoNar as in (A) and corresponding sgRNAs targeting NRF2 or a control were treated with KI696 and cells were analyzed as in (A) (see also Figure S4J). (C-D) Supplementation with NMN restores the NADH/NAD+ ratio following NRF2 activation and rescues proliferation in KEAP1-dependent cells. KEAP1-dependent NSCLCs were treated with KI696 and NMN (1mM) where indicated and analyzed as in (A) or assayed for a change in proliferation by crystal violet staining 6 days post treatment (D) (Data are represented as a mean ± SEM, n= 4–5 biological replicates) (see also Figure S4K). (E) Over-expression of NADH oxidizing enzymes partially rescues NRF2 activation. CALU6 cells stably expressing NDI1, LbNOX or METAP2 (control) were treated with KI696 and assayed for proliferation as described in (D) (Data are represented as a mean ± SEM, n= 5 biological replicates). (F) KEAP1-dependent cells have a higher rate of Complex I NADH oxidation compared to KEAP1-independent NSCLCs. NSCLC cell lines stably expressing SoNar were treated with rotenone (0.5 μM) and analyzed by flow cytometry taking the ratio of the emission intensity at λem 530nm after excitation at λex 405 nm (NADH binding) or λex 488 nm (NAD+ binding).
