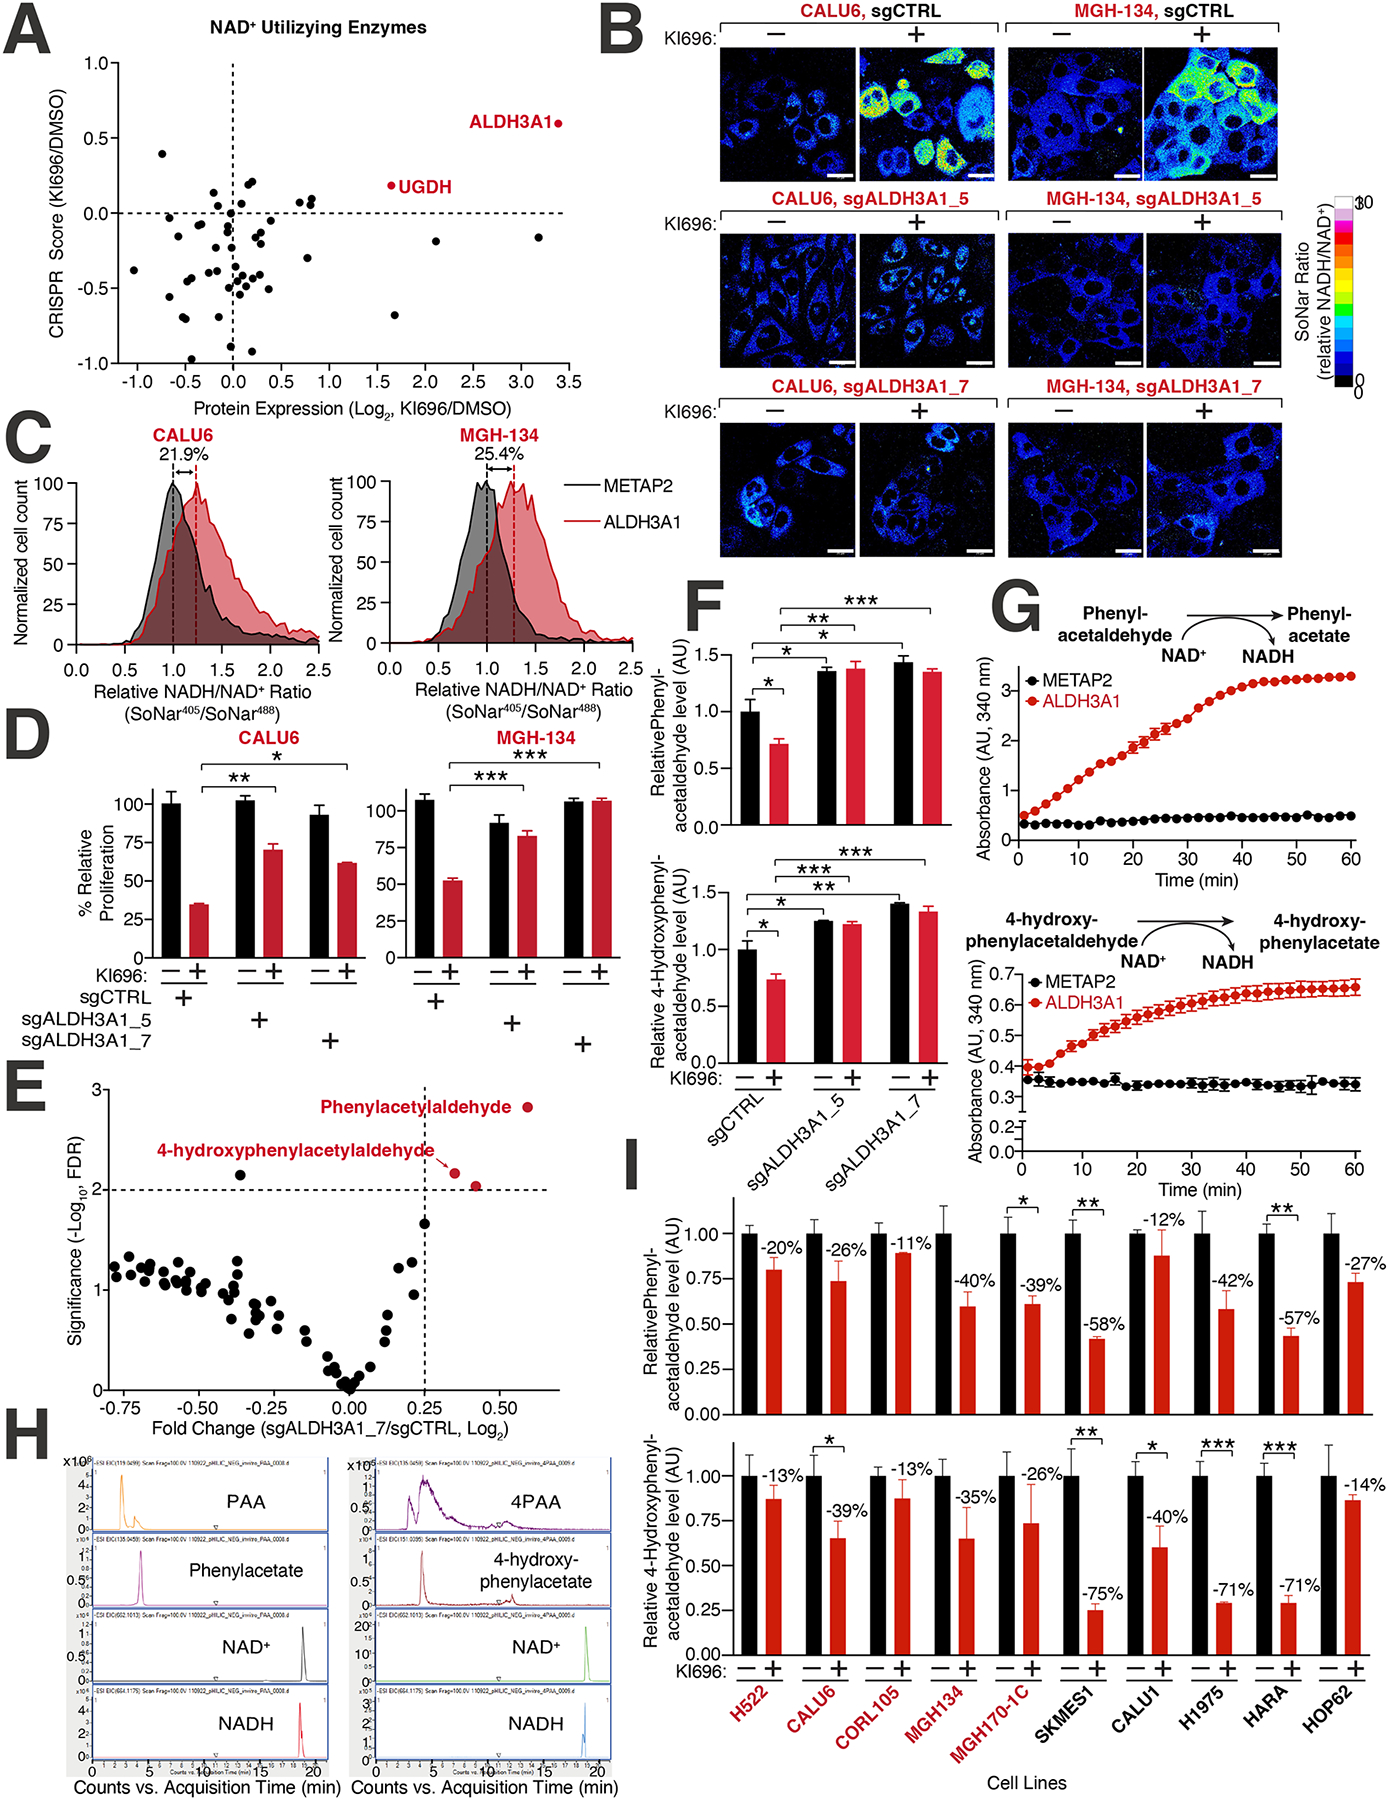
Figure 5: Identification of ALDH3A1 as a mediator of NRF2 reductive stress.

(A) Expression and dependency of NAD+ utilizing enzymes following NRF2 activation in CALU6 cells. Scatter plot of NAD+-utilizing enzymes identified in metabolism-focused CRISPR screen (see also Table S2) and proteomics (see also Figure S3C) following KI696 treatment. (B) ALDH3A1 depletion rescues high NADH levels following NRF2 activation. CALU6 and MGH-134 cells stable expressing SoNar and the indicated sgRNAs were treated with KI696 for 48 hrs. The representative NADH/NAD+ ratiometric image was constructed by taking the ratio of the emission intensity of 405 nm (NADH binding) vs 488 nm (NAD+ binding) for SoNar (see also Figure S5G). (C) ALDH3A1 is sufficient to increase NADH/NAD+ ratio in KEAP1-dependent cells. The NADH/NAD+ ratio CALU6 or MGH-134 cells expressing SoNar and over-expressing ALDH3A1 or Metap2 (control) was determined by flow cytometry. (D) Loss of ALDH3A1 rescues proliferation following NRF2 activation. KEAP1-dependent NSCLC cells expressing the indicated sgRNAs were treated with KI696 (1 μM) and proliferation was determined as described in (D) (Data are represented as a mean ± SEM, n= 5 biological replicates per condition). (E) ALDH3A1 regulates aldehyde levels in KEAP1-dependent cells. Plot compares fold change with corresponding significance for mass spectrometry analysis of CALU6 cells expressing the indicated sgRNAs. Each data point corresponds to an m/z value consistent with an aldehyde identified in human cells92 (see also Table S5, Methods). (F) PAA and 4PAA are regulated by ALDH3A1. CALU6 cells expressing the indicated sgRNAs were treated with KI696 for 48 hrs and the relative levels of metabolites consistent with PAA and 4PAA were analyzed as described in (E) (Data are represented as a mean ± SEM, n= 3 biological replicates). (G) PAA and 4PAA are ALDH3A1 substrates. PAA and 4PAA and NAD+ were added to highly purified ALDH3A1 or a control protein (METAP2) and NADH accumulation was determined in vitro by monitoring its absorbance at 340 nm (Data are represented as a mean ± SEM, n= 3 biological replicates). (H) Liquid chromatography mass spectrometry (LCMS)-based fragmentation corresponding to substrates (NAD+, PAA, 4PAA) and products (NADH, phenylacetate, 4-hydroxyphenylacetate) from ALDH3A1 reaction conducted in (G) (see also Methods). (I) PAA and 4PAA levels are regulated by NRF2. The indicated cell lines were treated with KI696 for 48 hrs and metabolites consistent with PAA or 4PAA were determined as described in (E) (Data are represented as a mean ± SEM, n= 3 biological replicates and normalized to DMSO treated samples) * indicates p-values < 0.05, ** indicates p-values < 0.01, *** indicates p-values < 0.0001. One-way ANOVA with Sidak’s post-hoc correction was used to determine statistical significance. Scale bar: 25 μm.
