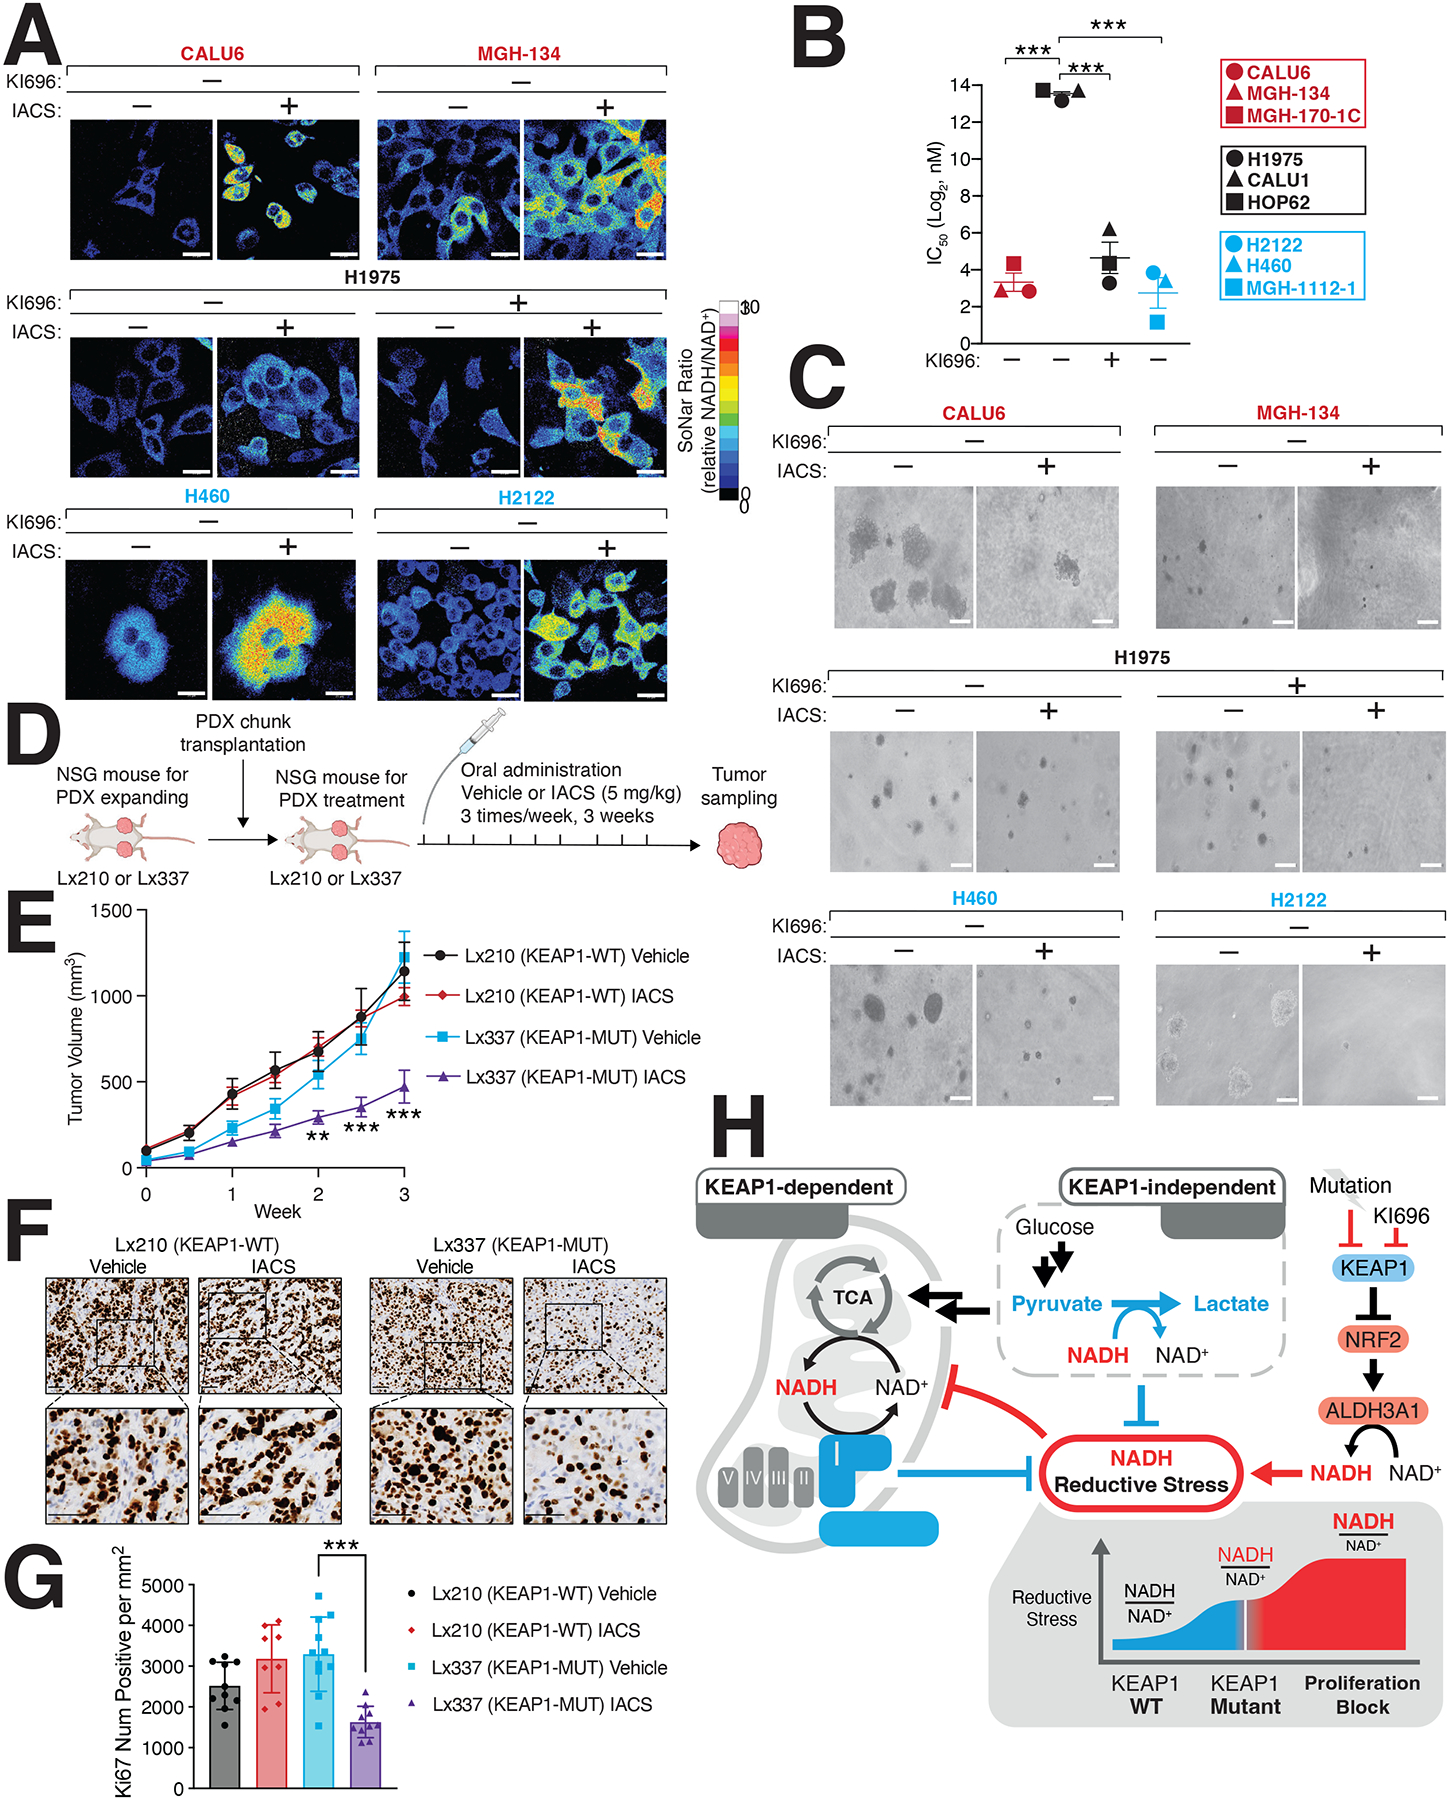
Figure 6: Inducing NADH-reductive stress selectively blocks proliferation of NRF2-activated NSCLCs.

(A) IACS-010759 (IACS) a Complex-I inhibitor, selectively increases NADH/NAD+ ratio in KEAP1-dependent (red) and KEAP1-mutant cells (blue) but not KEAP1-independent cells. NSCLC cells stably expressing SoNar were treated with IACS and analyzed by immunofluorescence. The representative NADH/NAD+ ratiometric image was constructed by taking the ratio of the emission intensity of 405 nm (NADH binding) vs 488 nm (NAD+ binding) for SoNar (see also Figure S6A). (B) IACS selectively blocks NSCLC proliferation following NRF2 activation. IC50 values were calculated for each cell line and where indicated cells were also treated with KI696 (1 μM) (Data are represented as a mean ± SEM, n= 6 biological replicates). (C) IACS selectively inhibits the anchorage-independent growth of NSCLCs with hyperactivate NRF2 signaling. Representative images of NSCLC cell lines grown in soft agar following treatment with IACS-017509 (200 nM) or co-treated with KI696 (1 μM) as indicated (Data are represented as a mean ± SEM, n= 6–8 biological replicates) (see also Figure S6C). (D) Schematic for in vivo study. (E) IACS selectively blocks the growth of KEAP1-mutant tumors. Relative tumor growth of subcutaneous patient-derived xenografts (PDX) WT or mutant (MUT) for KEAP1 receiving vehicle or IACS (5 mg/kg) (Data are normalized to first treatment, n=10 KEAP1-WT, Vehicle; 12 KEAP1-WT IACS, 14 KEAP1-MUT Vehicle, 18 KEAP1-MUT IACS (see also Figure S6E). (F-G) Representative immunohistochemistry staining (F) and quantification of Ki67 serial sections taken from KEAP1-WT and KEAP1-MUT PDX tumors treated with IACS or vehicle. (H) Model. NRF2 activation following pharmacologic inhibition or mutation of KEAP1 increases ALHD3A1 resulting in NADH reductive stress. KEAP1-dependent and -independent cells utilize different NADH oxidation pathways to counter reductive stress. * indicates p-values < 0.05, ** indicates p-values < 0.01, *** indicates p-values < 0.0001. One-way ANOVA with Sidak’s post-hoc correction was used to determine statistical significance. Scale-bar: 25 μm for immunofluorescence and 50 μM for soft agar and immunohistochemistry.
