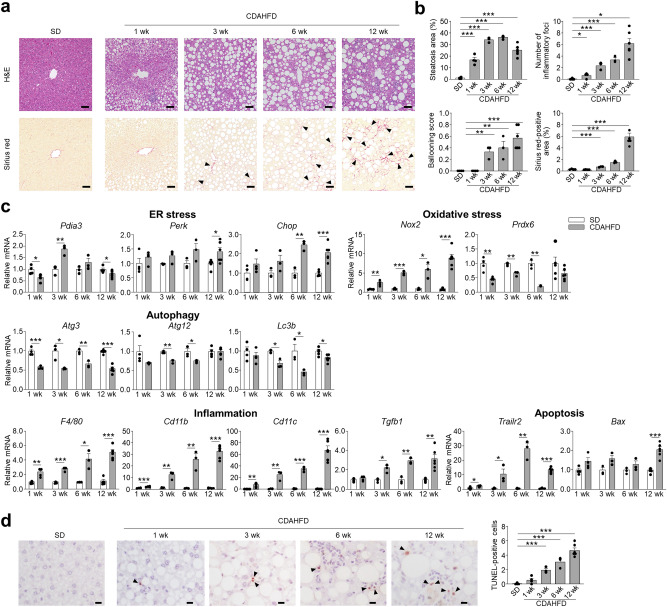
Figure 1.
CDAHFD group develop liver injury and fibrosis associated with dysregulated expression of ER stress, oxidative stress, and autophagy related genes. (a) Representative images of hematoxylin and eosin (H&E)- and Sirius red-stained liver sections. Arrowheads indicate Sirius red-positive area. Scale bars: 50 μm. (b) Quantification of steatosis area, lobular inflammation, hepatocellular ballooning, and Sirius red-positive area. The degree of lobular inflammation was evaluated by counting the number of inflammatory foci. (c) Hepatic mRNA expression of ER stress, oxidative stress, autophagy, inflammation, and apoptosis related genes was analyzed by real-time PCR. (d) Representative images of TUNEL staining of liver sections (left). Arrowheads indicate TUNEL-positive cells. Scale bars: 10 μm. Quantification of TUNEL-positive cells (right). Data are shown as mean ± SEM for n = 3–6 per group. *P < 0.05, **P < 0.01 and ***P < 0.001, by unpaired two-tailed Student’s t test.

