Figure 3.
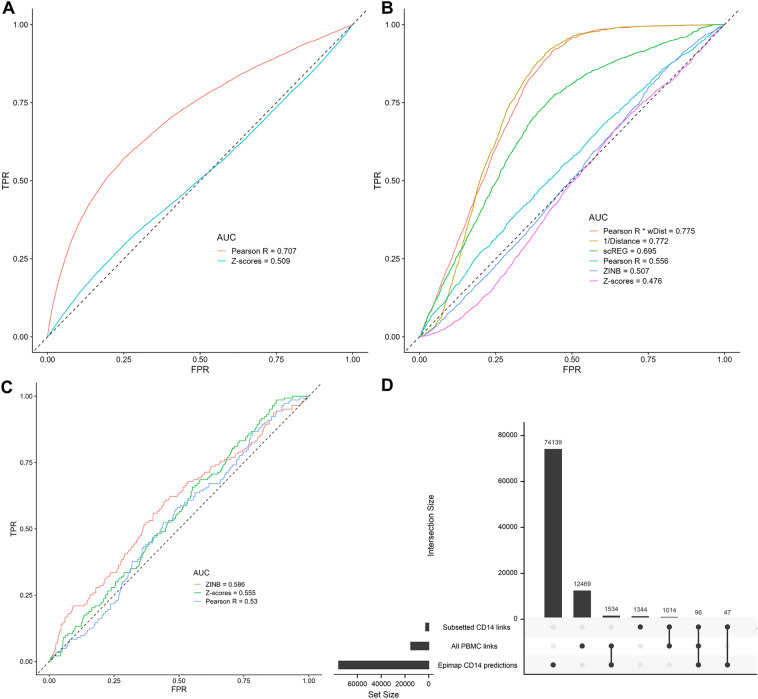
The Pearson R method more accurately validates Epimap-predicted links between cCRE and target genes in CD14 cells. (A) We used the Pearson R and Z-scores methods to detect links between ATACseq peaks and target genes (590,842 links with |Pearson R|> 0.01) in the complete (i.e., using all PBMC to compute statistics) PBMC multiomic dataset. Then, we performed Receiving Operating Curves (ROC) analyses to compare the identified peak-gene links from the multiomic data with regulatory links in CD14 cells predicted by the Epimap Project. (B) As in (A), but using a smaller set of links defined using a more stringent statistical threshold (15,113 links with |Pearson R|> 0.1). All cell-types are used to identify links, except for scREG which by design output link scores by cell-type (in this case, CD14 cells). (C) As in (B), but limiting these ROC analyses to links between ATACseq peaks and target genes with |Pearson R|> 0.1 that were found in the CD14 cells subset of the PBMC multiomic dataset. (D) Upset plot that shows the intersections of links identified between ATACseq peaks and target genes using either the full PBMC multiomic dataset or only the CD14 cells subset with cCRE-gene regulatory links in CD14 cells as predicted by the Epimap Project. ZINB; zero-inflated negative binomial, wDist; weighted distance (e(−distance/200 kb)), TPR, true positive rate; FPR, false positive rate.

