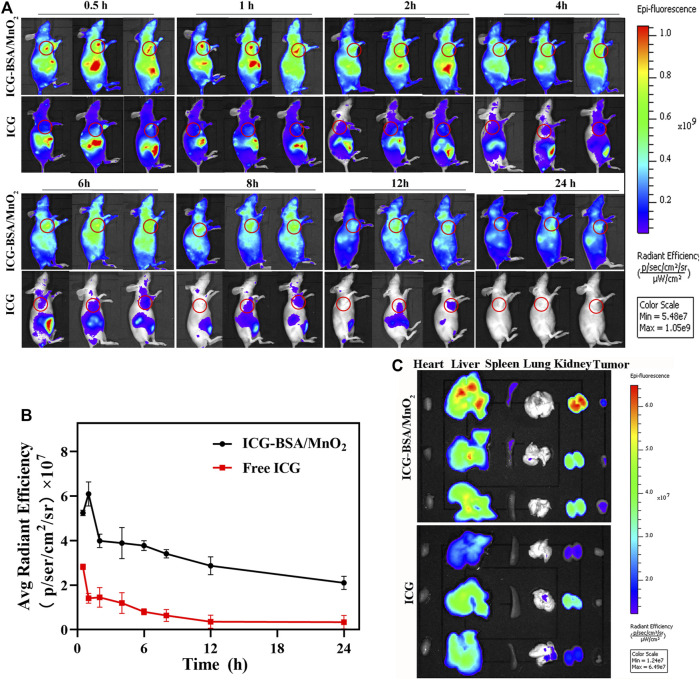
FIGURE 4.
In vivo as well as ex vivo biodistribution of free ICG and ICG-BSA/MnO2 NPs following IV injection. (A) In vivo entire-animal imaging of ICG fluorescence at several time points (0.5, 1, 2, 4, 6, 8, 12, and 24 h) following IV administration of free ICG and ICG-BSA/MnO2 NPs (the tumor zone is circled in red); (B) measuring the fluorescence intensity of tumors in MCF-7/ADR-bearing BALB/c nude mice at developed time points (0.5, 1, 2, 4, 6, 8, 12, as well as 24 h) after IV injection of free ICG along with ICG-BSA/MnO2 NPs; (C) Ex-vivo imaging of main organs and tumors distribution of ICG following IV administration of free ICG and ICG-BSA/MnO2 NPs for 24 h.

