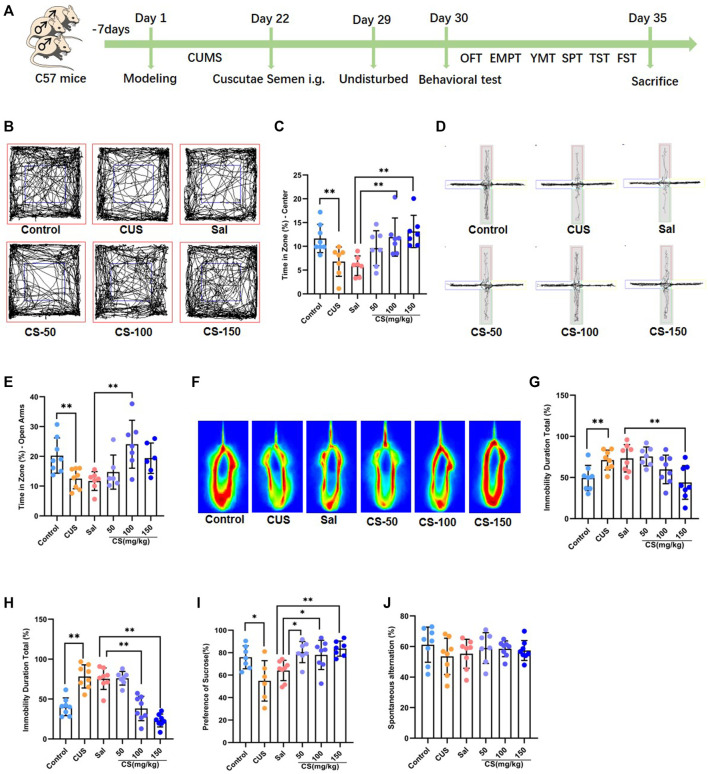
FIGURE 1.
CS relieved depression-like behaviors in mice exposed to CUS. (A) Experimental procedure. (B, C) The motion trail and time spent in the center zone in the OFT. (D, E) The motion trail and time spent in the open arms in the EPMT. (F, G) The percentage of immobility time in the TST. (H) The percentage of immobility time in the FST. (I) The percentage of sucrose in the SPT. (J) Spontaneous alternation in the FST. Data are expressed as the mean ± standard error. *p < 0.05, **p < 0.01.

