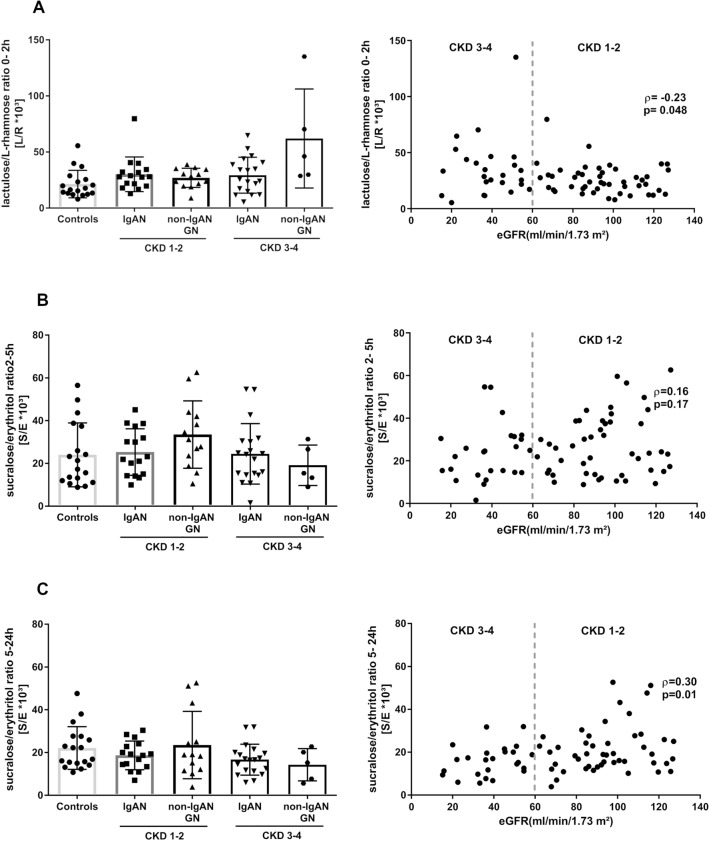
Fig. 3.
Association of CKD stages and gut permeability indices. A The 0–2 h-L/R ratio presented by CKD stages 1–2 and CKD stages 3–4 in patients with IgAN and non-IgAN GNs compared to healthy controls. The 0–2 h-L/R ratio did not change in IgAN patients with CKD Stages 3–4 compared to those in CKD stages 1–2. Patients with non-IgAN GNs in CKD stages 3–4 exhibited a non-significant increase in the mean 0–2 h-L/R ratio compared to non-IgAN GNs in CKD stages 1–2. The overall correlation of 0–2 h-L/R ratio and the patients’ eGFR was weak. B There were no changes in the 2–5 h-S/E ratio across all patient groups and CKD stages. The overall correlation of the 2–5 h-S/E ratio and the patients’ eGFR was weak. C There was no difference between the 5–24 h-S/E ratio between the patients with glomerular diseases and IgAN compared to healthy controls in CKD stages 1–2. The 5–24 h-S/E ratio of IgAN patients with CKD stages 1–2 was no different to those in CKD stages 3–4. Patients with other GNs showed a non-significant decrease of the 5-24 h- S/E ratio in CKD stages 3–4 compared to CKD stages 1–2. 0–2 h-L/R ratio, 0–2-h lactulose/l-rhamnose ratio; 2–5 h-S/E ratio, 2–5-h sucralose/erythritol (2–5 h-S/E) ratio; 5–24 h-S/E ratio, 5–24-h sucralose/erythritol ratio

