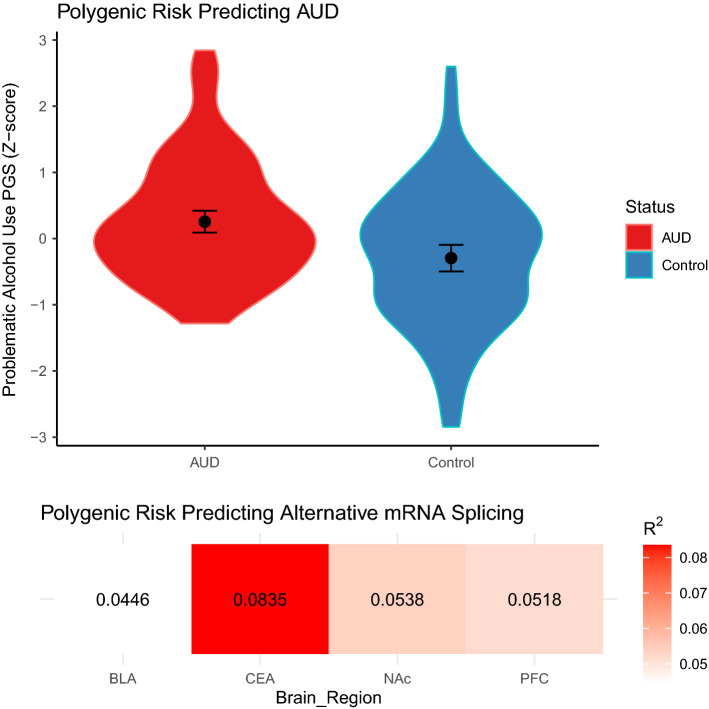
Figure 2.
Genetic risk for AUD and alternative mRNA Splicing. (A) Violin plot showing polygenic score distributions of AUD between individuals with AUD and controls. Mean and standard error are shown. P-value thresholds were 0.0183, 0.1016, 0.3522 and 0.0187 for the BLA, CEA, NAc and PFC, respectively. Scores were combined across brain regions and tested between AUD cases and controls. (B) Heat matrix showing the amount of variance explained (R2) by polygenic score analyses of differential splicing results for each brain region. Principal components (PC) analysis was used to distil differential splicing results into a single metric (1st PC). Polygenic score p-value thresholds were 5.e−5, 0.006, 5e−5 and 0.0012 for the BLA, CEA, NAc and PFC, respectively.

