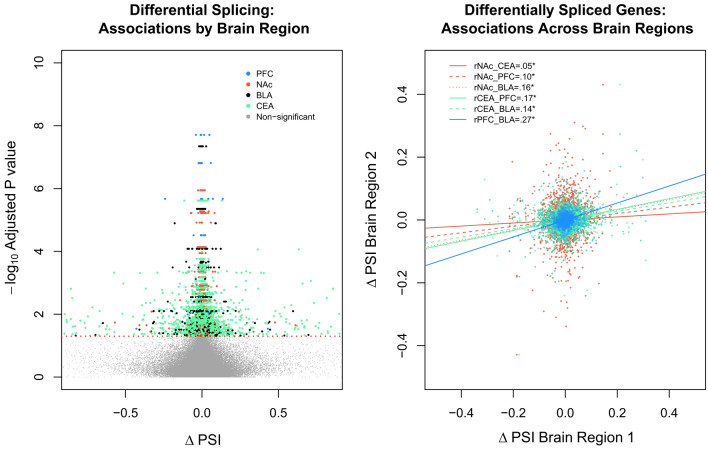
Figure 3.
Alternative mRNA splicing associations with AUD by brain region. (A) Volcano plot displaying differentially spliced genes between individuals with AUD and controls for each brain region. (B) Scatter plot showing differential splicing associations across brain regions from differentially spliced genes. Note ΔPSI stands for the change in percent-spliced-in and that each colored dot represents a specific splicing event in a cluster from a significantly differentially spliced gene (padj < 0.05).

