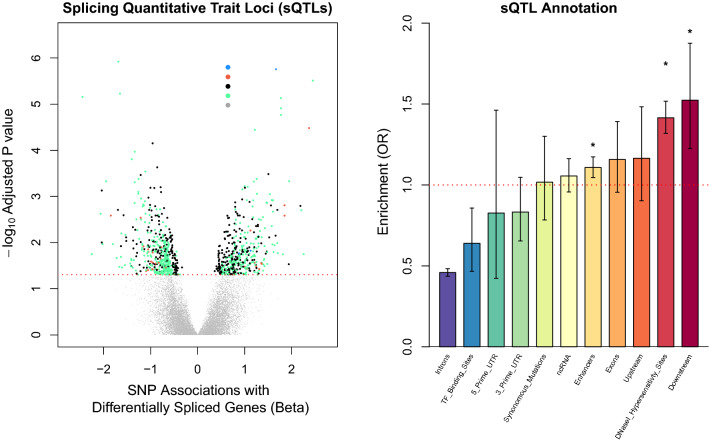
Figure 4.
Individual DNA markers linked with alternative mRNA splicing events associated with AUD. (A) Volcano plot showing results from our sQTL analyses. Each dot above the dashed red line represents a significant (padj < 0.05) SNP association with a differentially spliced gene. (B) Bar plot showing the genomic regions enriched for significant sQTL associations. * indicated that a certain genomic region survived correction for multiple testing (padj < 0.05).

