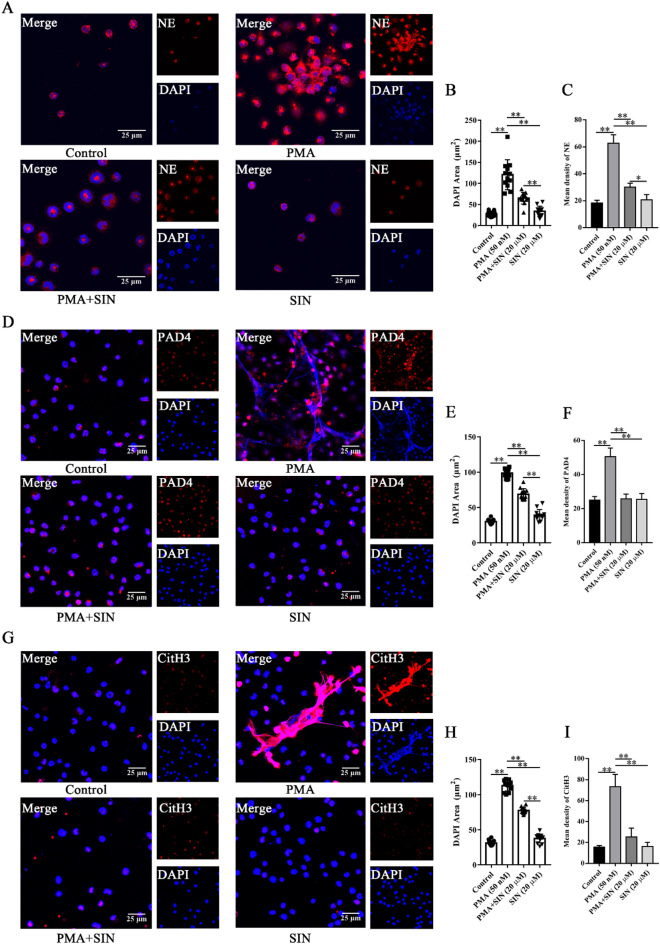
Figure 7.
Sinomenine inhibited the formation of NETs in vitro. (A) IF staining was used to determine the level of NE in neutrophils. Representative images are shown. (B) The nuclear areas in (A). The data are shown as the mean ± SD. (C) The mean density of NE in (A). The data are shown as the mean ± SD (n = 3). (D) IF staining was used to determine the level of PAD4 in neutrophils in each group. Representative images are shown. (E) The nuclear areas in (D). The data are shown as the mean ± SD. (F) The mean density of PAD4 in (D). The data are shown as the mean ± SD (n = 3). (G) IF staining was used to determine the level of CitH3 in the neutrophils in each group. Representative images are shown. (H) The nuclear areas in (G). The data are shown as the mean ± SD. (I) The mean density of CitH3 in (G). The data are shown as the mean ± SD (n = 3). *p < 0.05, **p < 0.01.

