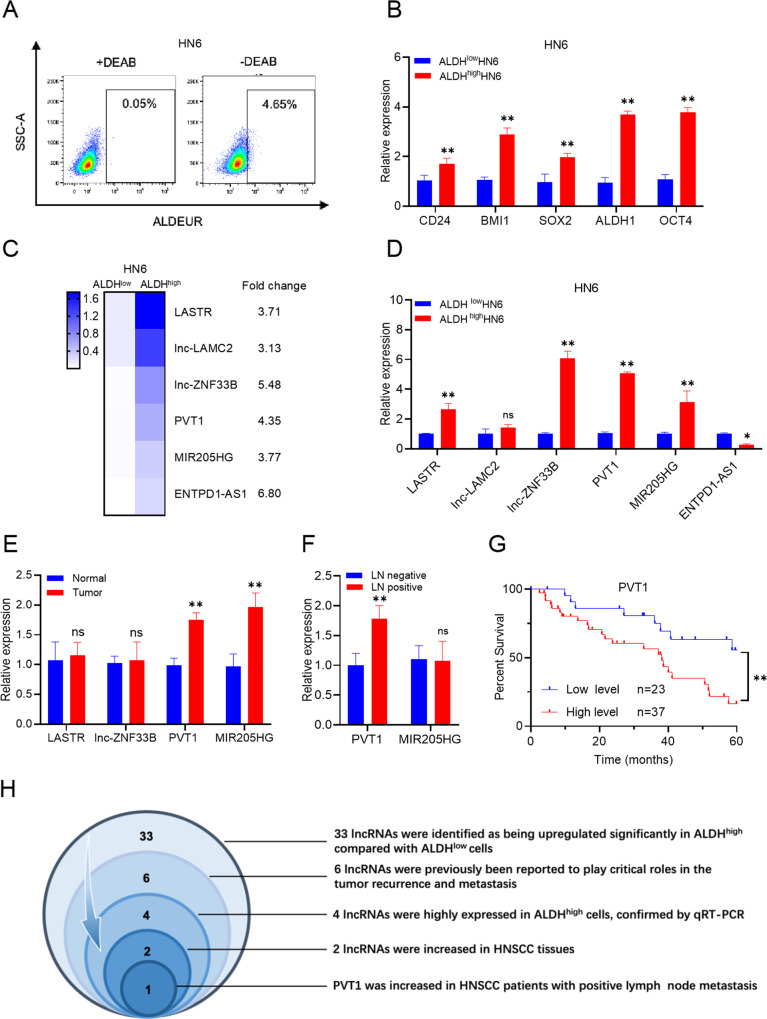
Fig. 1. PVT1 is highly expressed in CSCs and correlates with metastasis.
A ALDHhigh CSC-like cells and ALDHlow non-CSC-like cells were identified among HN6 cells employing fluorescence-activated cell sorting (FACS). An ALDEFLUORTM kit (ALDEUR) was used to sort ALDHhigh CSC-like cells as per the manufacturer’s protocol. A specific inhibitor of ALDH, diethylaminobenzaldehyde (DEAB), was used to control for background fluorescence. B qRT-PCR analysis of HNSCC CSC-characteristic genes in ALDHhigh CSCs and ALDHlow non-CSCs. The expression levels of CD24, BMI1, SOX2, ALDH1, and OCT4 were normalized to that of GAPDH using the 2−ΔΔCt method. Data are shown as the mean ± SD. **p < 0.01 using an unpaired Student’s t-test. C RNA-sequencing data heatmap showing the expression of six lncRNAs candidates with known roles in tumor metastasis and recurrence. Fold changes are shown on the right. D qRT-PCR assessment of six lncRNAs in ALDHhigh CSCs and ALDHlow non-CSCs. Data are shown as the mean ± SD. ns, p > 0.05, *p < 0.05, and **p < 0.01 using an unpaired Student’s t-test. E qRT-PCR assessment of four lncRNAs in human HNSCC and adjacent normal tissues. Data are shown as the mean ± SD (n = 30). ns, p > 0.05 and **p < 0.01 using a paired Student’s t-test. F qRT-PCR assessment of two lncRNAs in HNSCC tissues with lymph node metastases (LN positive) or without lymph node metastases (LN negative). Data are shown as the mean ± SD (n = 20). ns, p > 0.05 and **p < 0.01 using a paired Student’s t-test. G Kaplan-Meier analysis of the relationship between overall survival and PVT1 expression levels in HNSCC patients (n = 60). **p < 0.01 using the Log-Rank test. H Schematic of the process of lncRNA screening in HNSCC.

