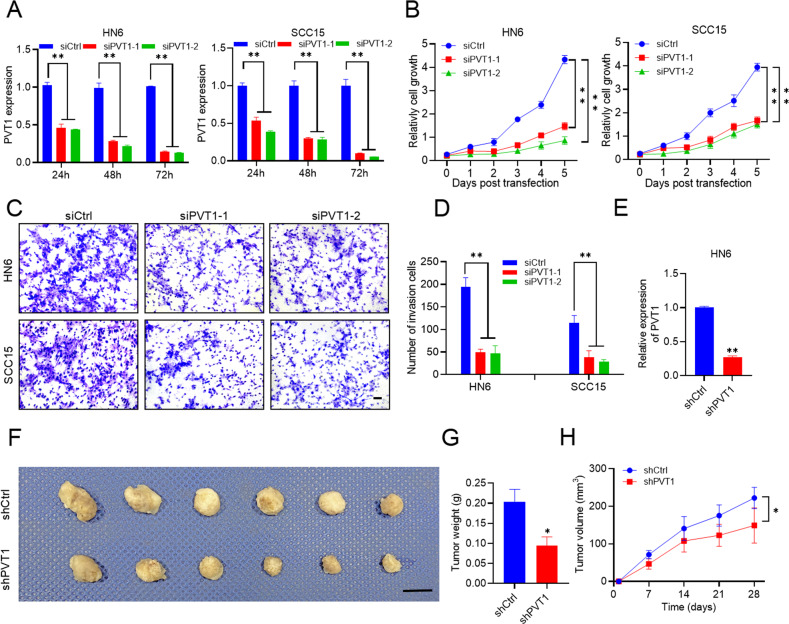
Fig. 2. Knockdown of PVT1 inhibits HNSCC proliferation and invasion.
A qRT-PCR assessment of PVT1 expression in HN6 and SCC15 cells transfected with the siRNA control (siCtrl), siRNA PVT1-1 (siPVT1-1), and siRNA PVT1-2 (siPVT1-2) for 24, 48, and 72 h. Data are shown as the mean ± SD. **p < 0.01 using an unpaired Student’s t-test. B The impact of PVT1 knockdown (KD) on HN6 and SCC15 cell proliferation. Data are shown as the mean ± SD. **p < 0.01 using an unpaired Student’s t-test. C, D The impact of PVT1 KD on HN6 and SCC15 cell invasion after 24 h. Scale bar: 100 μm. Data are shown as the mean ± SD. **p < 0.01 using an unpaired Student’s t-test. E qRT-PCR assessment of PVT1 expression in HN6 cells infected with shRNA control (shCtrl) and shRNA PVT1 (shPVT1). Data are shown as the mean ± SD. **p < 0.01 using an unpaired Student’s t-test. F Image of the nude mice subcutaneous tumor model established using HN6 cells with PVT1 KD. Scale bar: 1 cm. G The weight of PVT1 KD HN6 tumors in nude mice. Data are shown as the mean ± SD (n = 6). *p < 0.05 using an unpaired Student’s t-test. H The volume of PVT1 KD HN6 tumors in nude mice. Data are shown as the mean ± SD (n = 6). *p < 0.05 using an unpaired Student’s t-test.

