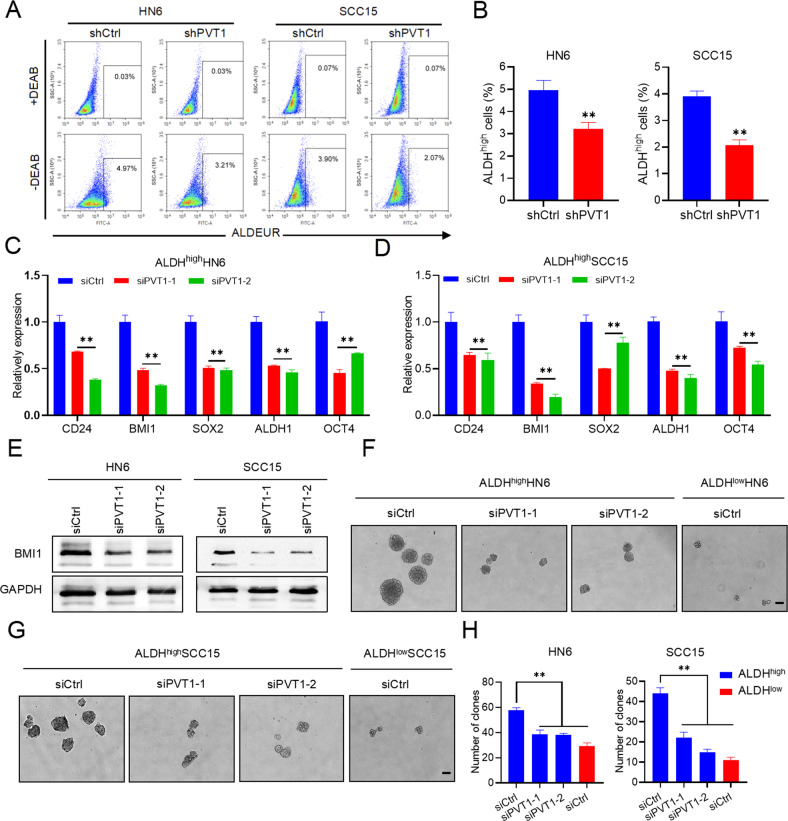
Fig. 3. PVT1 KD suppresses cancer stemness.
A, B An ALDEFLUOR assay was conducted in HN6 and SCC15 cells with PVT1 KD, and flow cytometry was used to quantify the percentage of ALDHhigh cells. Data are shown as the mean ± SD. **p < 0.01 using an unpaired Student’s t-test. C, D qRT-PCR assessment of stemness-related marker expression in ALDHhigh HN6 and SCC15 cells with PVT1 KD. Data are shown as the mean ± SD. **p < 0.01 using an unpaired Student’s t-test. E Western blot analysis of BMI1 in HN6 and SCC15 cells with PVT1 KD. F, G Image of tumorspheres formed by ALDHhigh and ALDHlow HNSCC cells transfected with the indicated siRNAs. Scale bar: 100 μm. H The numbers of tumorspheres formed by ALDHhigh and ALDHlow HNSCC cells transfected with the indicated siRNAs. Data are shown as the mean ± SD. **p < 0.01 using an unpaired Student’s t-test.

