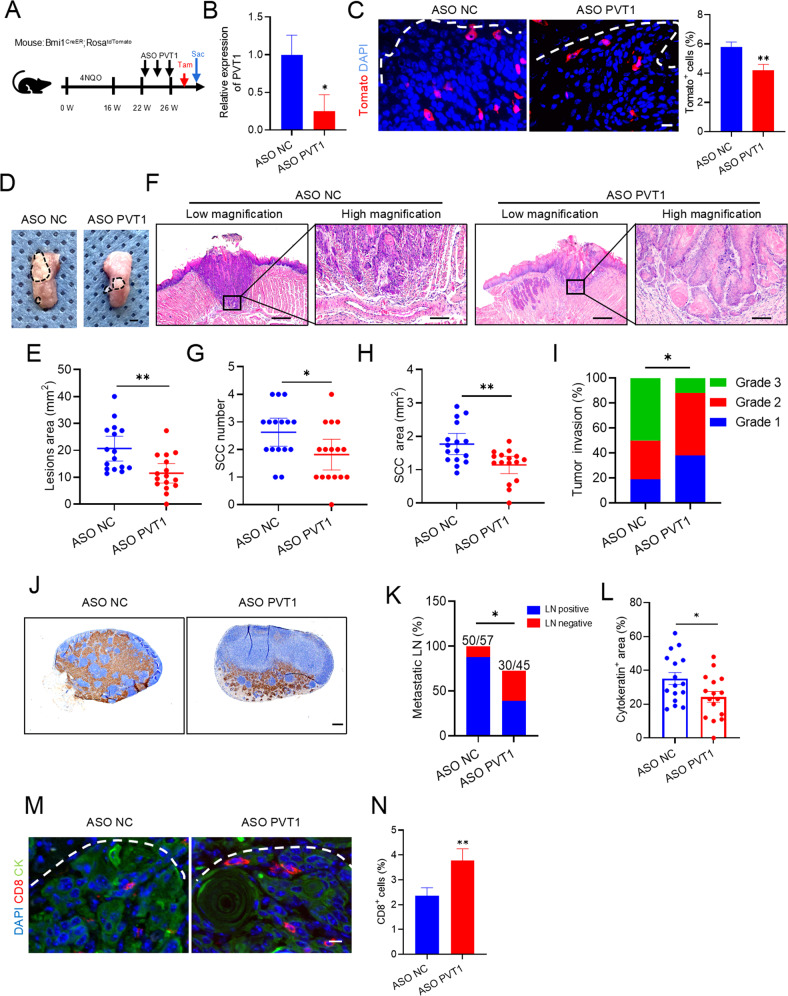
Fig. 5. PVT1 inhibition eliminates CSCs and stimulates anti-tumor immunity in an immunocompetent microenvironment.
A A schematic diagram of the experimental design for treatment and lineage tracing of primary HNSCC in Bmi1CreER; RosatdTomato mice. For labeling the Bmi1+ CSCs, mice were injected with 2.5 mg Tamoxifen (Tam) in a single dose before sacrificing (Sac) mice. B qRT-PCR analysis of PVT1 expression in ASO NC and ASO PVT1. Data are shown as the mean ± SD. *p < 0.05 by unpaired Student’s t-test. C Representative images of mice with Tomato+ Bmi1+ CSCs in HNSCC from different treatment groups as indicated. The white dotted line indicates the boundary between the tumor and interstitial tissue. Scale bar, 25 μm. Percentage of Tomato+ Bmi1+ CSCs in HNSCC from different treatment groups as indicated. Data are shown as the mean ± SD from at least two independent experiments. n = 16 **p < 0.01 by unpaired Student’s t-test. D Representative image of tumors in tongue from the different treatment groups. The lesion areas were circled with a black dotted line. Scale bar, 2 mm. E Quantification of the lesion area of mice with different treatment as indicated. Data are shown as the mean ± SD from at least two independent experiments. n = 16. **p < 0.01 by unpaired Student’s t-test. F Representative H&E-stained HNSCC of mice with different treatment as indicated. Low-magnification images are shown in the left panels. Scale bar, 500 μm. High-magnification images are shown in the right panels. Scale bar, 100 μm. G, H Quantification of tumor number and area in mice in the different treatment groups. Data are shown as the mean ± SD from at least two independent experiments. n = 16. *p < 0.05 and **p < 0.01 using an unpaired Student’s t-test. I Quantification of the grades of HNSCC invasion in mice from the different treatment groups. Results are presented from two independent experiments. n = 16. *p < 0.05 using a Cochran-Armitage test. J Image of anti-PCK immunostaining of cervical lymph nodes. Scale bar, 200 μm. K Proportion of mice with lymph node metastasis from the different treatment groups. The number of metastatic lymph nodes is shown. Results are presented from two independent experiments. *p < 0.05 using a χ2 test. L Quantification of the metastatic areas in lymph nodes from mice in the indicated treatment groups. Data are shown as the mean ± SEM from at least two independent experiments. *p < 0.05 using an unpaired Student’s t-test. M Images of immunofluorescence for CD8+ T cells from mice in the different treatment groups. The white dotted line indicates the boundary between interstitial tissue and the tumor. Scale bar, 10 μm. N Proportion of immunofluorescence for CD8+ T cells from mice in the different treatment groups. Data are shown as the mean ± SD from at least two independent experiments. n = 16. **p < 0.01 using an unpaired Student’s t-test.

