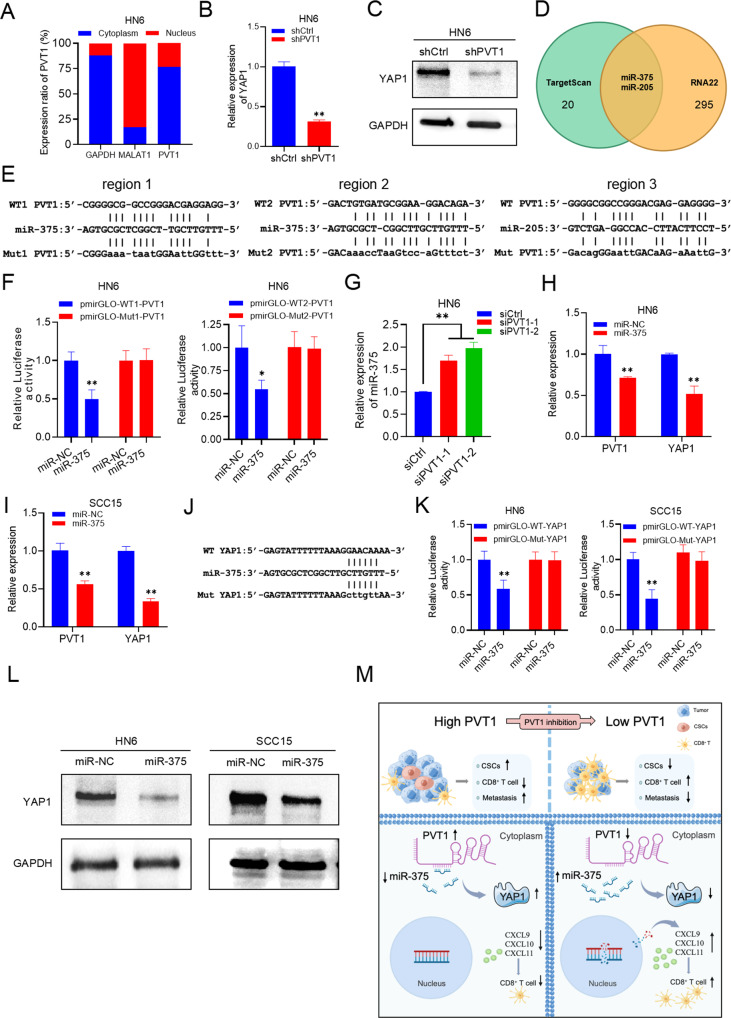
Fig. 8. PVT1 functions as a miRNA sponge for miR-375.
A The subcellular localization of PVT1 by qRT-PCR analysis in HN6 cells. MALAT1 and GAPDH transcripts were used as controls for the nuclear and cytoplasmic fractions. B qRT-PCR analysis of YAP1 expression in HN6 cells with PVT1 KD. Data are shown as the mean ± SD. **p < 0.01 using an unpaired Student’s t-test. C Western blot analysis of YAP1 in HN6 cells with PVT1 KD. D The overlapping miRNAs targeted by PVT1 and YAP1 from two online analysis tools, TargetScan and RNA22, were identified using a Venn diagram. E Bioinformatic analysis of miR-375/miR-205 binding to PVT1. F The relative luciferase activity in HN6 cells transfected with pmirGLO-WT1-PVT1, pmirGLO-WT2-PVT1, pmirGLO-Mut1-PVT1, pmirGLO-Mut2-PVT1, and miR-375 mimics (miR-375). Data are shown as the mean ± SD. *p < 0.05 and **p < 0.01 using an unpaired Student’s t-test. G qRT-PCR assessment of miR-375 expression in HN6 cells transfected with siPVT1-1/2. Data are shown as the mean ± SD. **p < 0.01 using an unpaired Student’s t-test. H qRT-PCR assessment of PVT1 and YAP1 expression levels in HN6 cells transfected with miR-375. Data are shown as the mean ± SD. **p < 0.01 using an unpaired Student’s t-test. I qRT-PCR assessment of PVT1 and YAP1 expression in SCC15 cells transfected with miR-375. Data are shown as the mean ± SD. **p < 0.01 using an unpaired Student’s t-test. J Bioinformatic analysis of miR-375 binding to YAP1. K The relative luciferase activity in HN6 and SCC15 cells transfected with pmirGLO-WT-YAP1, pmirGLO-Mut-YAP1 and miR-375. Data are shown as the mean ± SD. **p < 0.01 using an unpaired Student’s t-test. L Western blot analysis of YAP1 levels in HN6 and SCC15 cells transfected with miR-375. M A diagram shows that the PVT1 inhibition in HNSCC stimulates anti-tumor immunity, prevents metastasis, and depletes CSCs.

