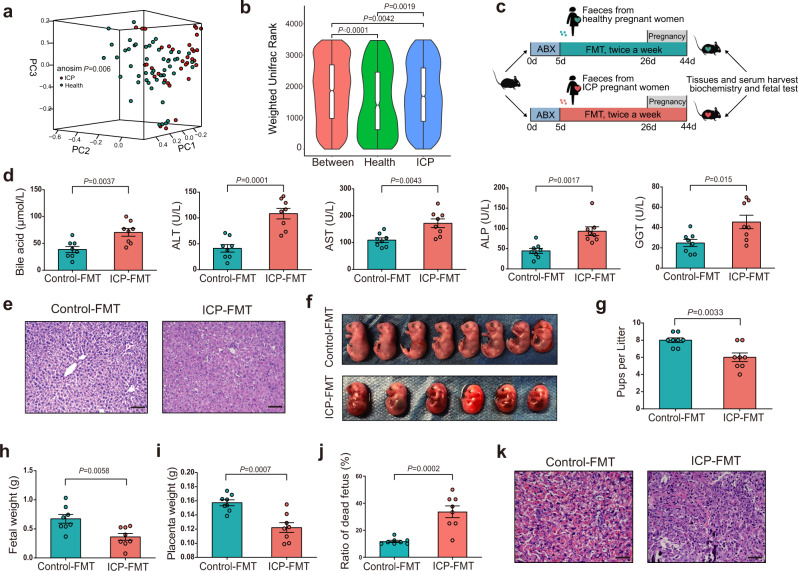
Fig. 1. Gut microbiota from ICP patients is altered significantly and sufficient to promote ICP in mice.
a Weighted Unifrac PCoA (principal coordinate analysis) plot of individuals with ICP patients and healthy controls. The ANOSIM test was used to calculate the significance of dissimilarity (ANOSIM, P = 0.001). b A truncated violin plot shows the comparison of Weighted Unifrac range of samples between ICP patients and healthy controls. The notch in the middle of the box represents the median. The top and bottom of box represent the 75th and 25th quartiles, respectively. The upper and lower whiskers extended 1.5× the interquartile range from the upper edge and lower edge of the box represent maximum and minimum, respectively. With a truncated violin plot, the curve of the violin extends only to the minimum and maximum values in the data set. Outlier values were not shown in this plot. n = 50 individuals with ICP, n = 41 individuals in healthy controls. The ANOSIM test was used to calculate the significance of dissimilarity. The exact P values were shown. c Experimental schematic: following antibiotics treatment, the recipient mice were transplanted with fecal samples from ICP patients or healthy controls. Tissues and samples were collected at E18d. d Analysis of serum levels of total bile acids, ALT, AST, ALP, and GGT (n = 8 mice per group). Data are presented as mean ± SEM. P values were determined by two-tailed Student’s t-test. e Hematoxylin and eosin staining of representative livers. Scale bar: 100 μm. f, g Number of pups per litter (n = 8 mice per group). The representative fetuses are from the same litter with the same gestational age. h–j Fetal weight (h), placenta weight (i) and ratio of dead fetus (j) in the two groups (n = 8 mice per group). P values were determined by two-tailed Student’s t-test for g–j. k Placenta tissues were stained with H&E. Representative images were shown. Scale bar: 50 μm. Data are presented as mean ± SEM for g–j. FMT fecal microbiota transplantation, ABX antibiotics cocktail, PC principal coordinate analysis, ANOSIM analysis of similarities. Source data are provided as a Source Data file.

