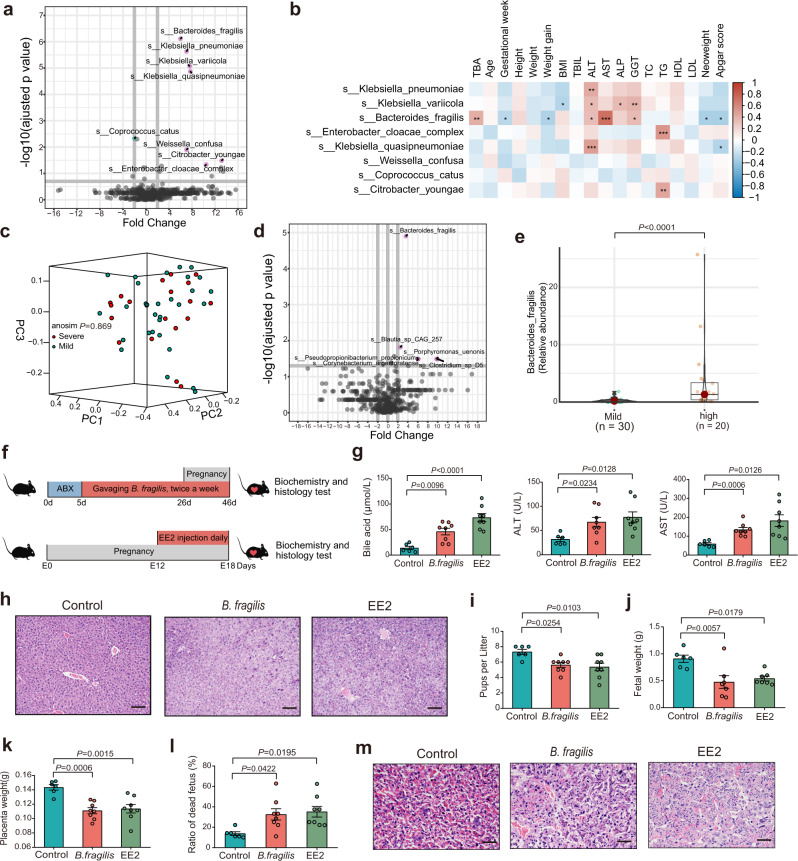
Fig. 2. B. fragilis induced intrahepatic cholestasis of pregnancy in mice.
a Differentially enriched bacteria between ICP patients and healthy controls. Pink dots represent bacteria with higher abundance in samples of ICP patients. Blue dots represent bacteria with higher abundance in samples of healthy controls. Grey dots represent bacteria with no significant difference between the two groups. P values were adjusted by Benjamini & Hochberg (BH) method to control FDR. FDR-adjusted P < 0.05 was shown. b Correlation heatmap of differentially enriched bacteria with the clinical characteristics. Pearson correlation analysis with FDR-adjusted P value. *P < 0.05; **P < 0.01; ***P < 0.001. c Weighted Unifrac PCoA plot of samples between the severe and mild groups in ICP patients. The ANOSIM test was used to calculate the significance of dissimilarity (ANOSIM, P = 0.869). d Differentially enriched bacteria between the severe and mild groups in ICP patients. Pink dots represent bacteria with relatively higher abundance in severe ICP patients. Grey dots represent bacteria with no significant difference between the two groups. P values were adjusted by Benjamini & Hochberg (BH) method to control FDR. FDR-adjusted P < 0.05 was shown. e The comparison of B. fragilis abundance between the two groups. The horizontal bar within box represents median. The top and bottom of box represent 75th and 25th quartiles, respectively. The upper and lower whiskers extended 1.5× the interquartile range from the upper edge and lower edge of the box represent maximum and minimum, respectively. P value was determined by two-tailed Mann–Whitney test. f Experimental schematic for gavaging B. fragilis. g Analysis of serum levels of total bile acids, ALT and AST in each group. Data are presented as mean ± SEM. P values were determined by ordinary one-way ANOVA with Tukey’s correction or Welch ANOVA with Games-Howell’s multiple comparisons test. n = 6 mice in control group, n = 8 mice in B. fragilis and EE2 group. h Representative images of H&E staining of livers in each group. Scale bar: 100 μm. i–l Number of pups per litter (i) in each group. n = 6 in control group, n = 8 in B. fragilis and EE2 group. Number of fetal weight (j) in each group. n = 6 in control group, n = 7 in B. fragilis and EE2 group. Number of placenta weight (k) and ratio of dead fetus (l) in each group. n = 6 in control group, n = 8 in B. fragilis and EE2 group. Data are presented as mean ± SEM for i–l. P values were determined by ordinary one-way ANOVA with Tukey’s correction for i–l. m Representative images of H&E staining of placenta in each group. Scale bar: 50 μm. ANOSIM analysis of similarities, EE2 17α-ethynylestradiol; Source data are provided as a Source Data file.

