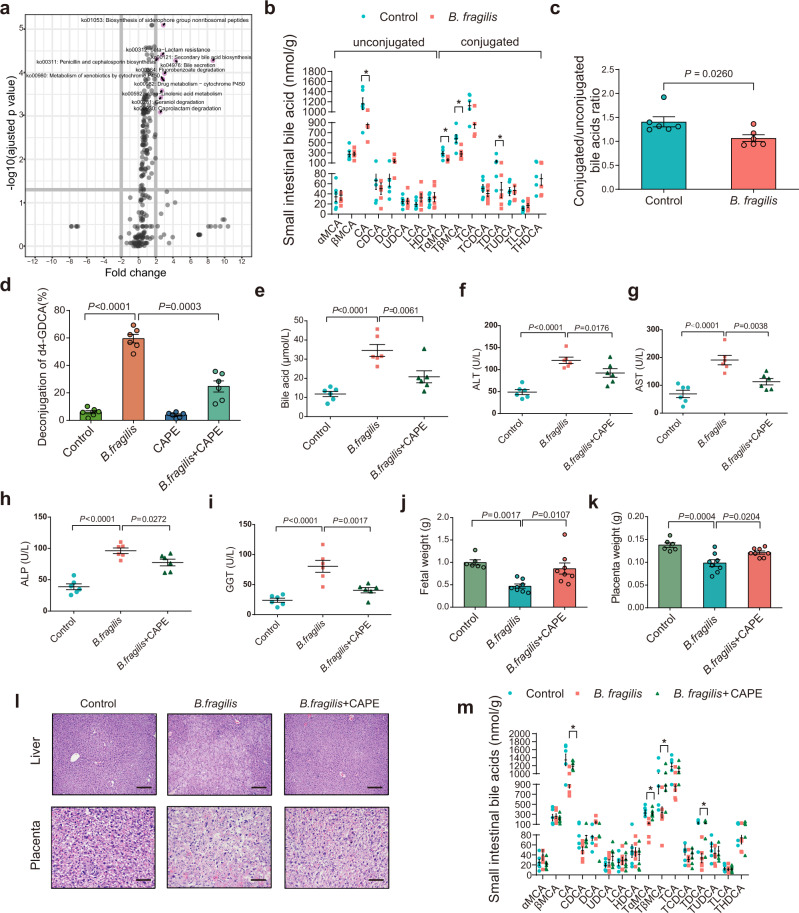
Fig. 3. B. fragilis promotes the ICP through its BSH activity mediating bile acid metabolism.
a Kyoto Encyclopedia of Genes and Genomes (KEGG) annotation of key altered metabolic pathways in individuals with ICP. P values were adjusted by Benjamini & Hochberg (BH) method to control FDR. FDR-adjusted P < 0.05 was shown. b Levels of small intestinal bile acids in B. fragilis transplanted mice or control group (n = 6 mice per group). P values were determined by two-tailed Student’s t-test. *P < 0.05. c Conjugated and unconjugated bile acids in B. fragilis transplanted mice or control group. n = 6 per group. P values were determined by two-sided Mann–Whitney test. d Hydrolysis efficiency of GDCA by B. fragilis with or without CAPE in vitro. P values were determined by Welch ANOVA with Games-Howell’s multiple comparisons test. n = 6 per group. e–i Mice were divided into three groups (control, B. fragilis and B. fragilis + CAPE). Analysis of serum levels of total bile acids (e), ALT (f), AST (g), ALP (h) and GGT (i) in each group. n = 6 per group. P values were determined by ordinary one-way ANOVA with Tukey’s correction. Fetal weight (j) and placenta weight (k) in each group (n = 6 in control group; n = 8 in B. fragilis group and B. fragilis + CAPE group). P values were determined by ordinary one-way ANOVA with Tukey’s correction. l Representative images of H&E staining of livers and placenta in each group. Scale bar = 100 μm for liver; scale bar = 50 μm for placenta. m Levels of small intestinal bile acids in indicated groups (n = 6 per group). P value was determined by one-way ANOVA with Tukey’s correction. *P < 0.05. Data are presented as mean ± SEM for b–k, m. CAPE caffeic acid phenethyl ester. Source data are provided as a Source Data file.

