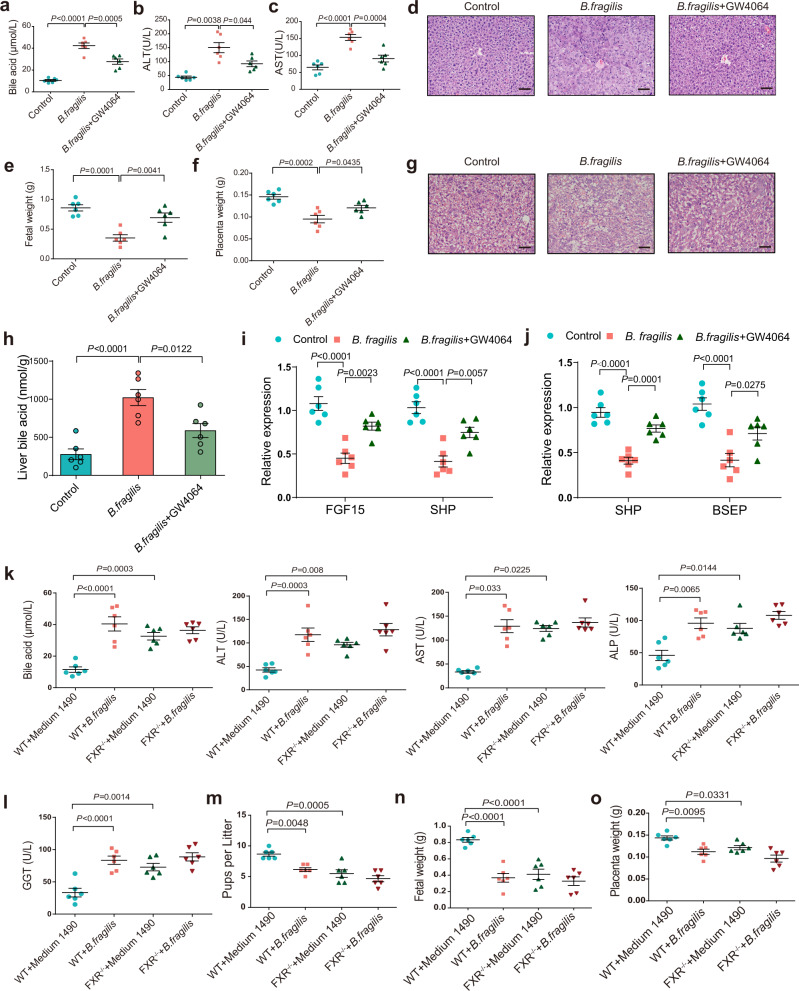
Fig. 5. FXR signaling is required for B. fragilis-induced ICP in mice.
a–c Analysis of serum levels of total bile acids (a), ALT (b) and AST (c) in each group (n = 6 per group). P values were determined by one-way ANOVA with Tukey’s correction or Welch ANOVA with Games-Howell’s multiple comparisons test. d Representative images of H&E staining of liver in each group. Scale bar: 50 μm. e, f Fetal weight (e) and placenta weight (f) in each group (n = 6 per group). P values were determined by one-way ANOVA with Tukey’s correction. g Representative images of H&E staining of placenta in each group. Scale bar: 50 μm. h Liver total bile acid levels in each group (n = 6 per group). i, j Relative expression of intestinal FXR target genes (i) and hepatic FXR target genes (j) in indicated groups. n = 6 per group. P values were determined by one-way ANOVA with Tukey’s correction. k, l Serum levels of total bile acids, ALT, AST, ALP, GGT in each group (n = 6 per group). m–o Number of pups per litter (m), fetal weight (n), and placenta weight (o) in each group (n = 6 per group). P values were determined by one-way ANOVA with Tukey’s correction or Welch ANOVA with Games-Howell’s multiple comparisons test or Kruskal-Wallis with Dunn’s multiple comparisons test depending on the sample distribution type for h-o. Data are presented as mean ± SEM for a–c, e, f, h–o. Source data are provided as a Source Data file.

