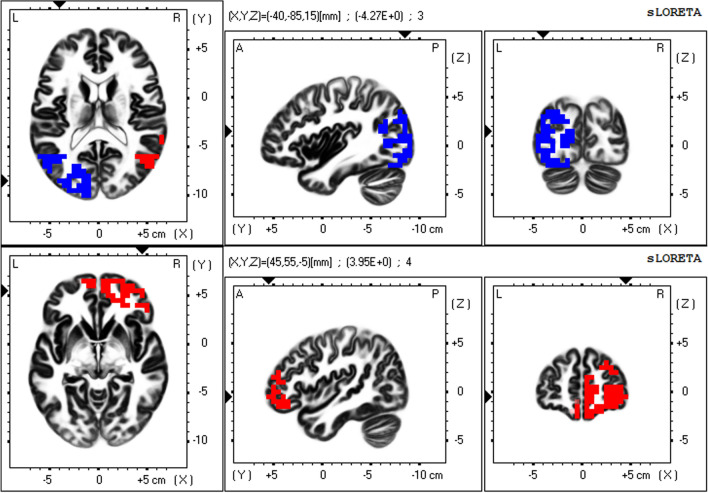
Figure 2.
Visual perception network. The visual perception network is composed of alpha and beta activity in the right ventral attention network (VAN) areas with anti-correlated alpha activity in the left posterior dorsal attention network (DAN) areas. The upper row shows alpha activity in the right temporal VAN areas with anti-correlated alpha activity in the left posterior DAN areas, and the lower row shows beta activity in the right prefrontal VAN areas. In the colour–coded maps, red and blue colours represent power increase and decrease with increasing network activity, respectively. Slices from left to right are axial, sagittal and coronal images (viewed from top, left and back). L, left; R, right; A, anterior; P, posterior.

