Figure 2.
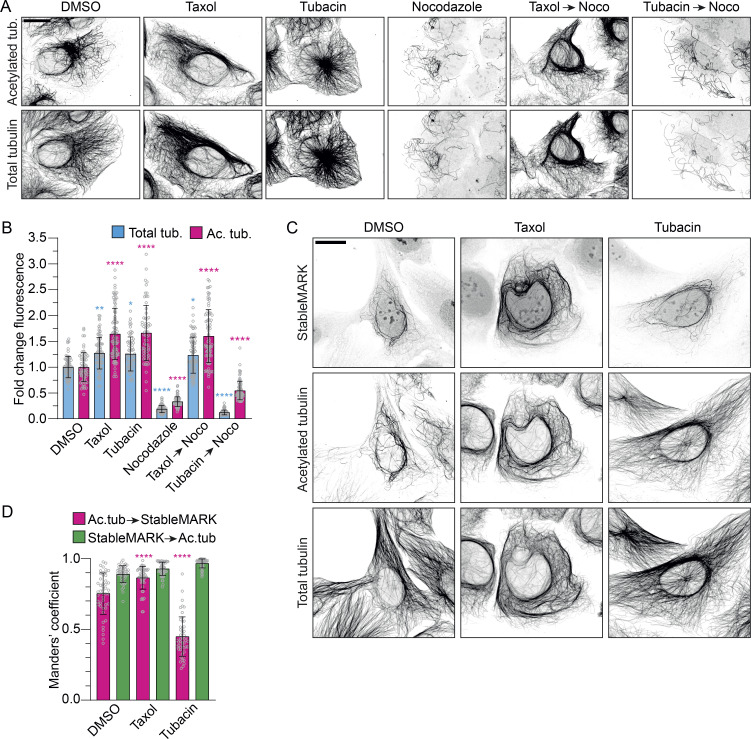
StableMARK labels the subset of stable MTs. (A) Fluorescence images of U2OS cells treated with 0.1% DMSO (3 h), 10 µM Taxol (2 h), 10 µM tubacin (2 h), 10 µM nocodazole (1 h), 10 µM Taxol (2 h) followed by 10 µM Taxol + 10 µM nocodazole (1 h), or 10 µM tubacin (2 h) followed by 10 µM tubacin + 10 µM nocodazole (1 h) and immunolabeled for acetylated tubulin and α-tubulin. (B) Bar graph showing the fold change in mean fluorescence intensity of acetylated tubulin and total tubulin normalized to the DMSO control for the different conditions described in A. Graph represents mean ± SD as well as individual values (gray circles) for 64–90 cells per condition from three independent experiments. Kruskal–Wallis test with Dunn’s multiple comparisons test. *P ≤ 0.05, **P ≤ 0.01, ****P ≤ 0.0001. (C) Fluorescence images of U2OS cells expressing StableMARK treated with 0.1% DMSO (2 h), 10 µM Taxol (2 h), or 10 µM tubacin (2 h) and immunolabeled for acetylated tubulin and α-tubulin. (D) Bar graph showing thresholded Manders’ coefficients measured from 12.5 × 12.5 µm ROIs per cell for the conditions described in C. Pink bars represent the colocalization coefficient for acetylated MTs to StableMARK-decorated MTs. Green bars represent the colocalization coefficient for StableMARK-decorated MTs to acetylated MTs. Graph represents mean ± SD as well as individual values (gray circles) for 47–52 cells per condition from three independent experiments. Kruskal–Wallis test with Dunn’s multiple comparisons test. ****P ≤ 0.0001. Scale bars, 20 µm (A and C).

