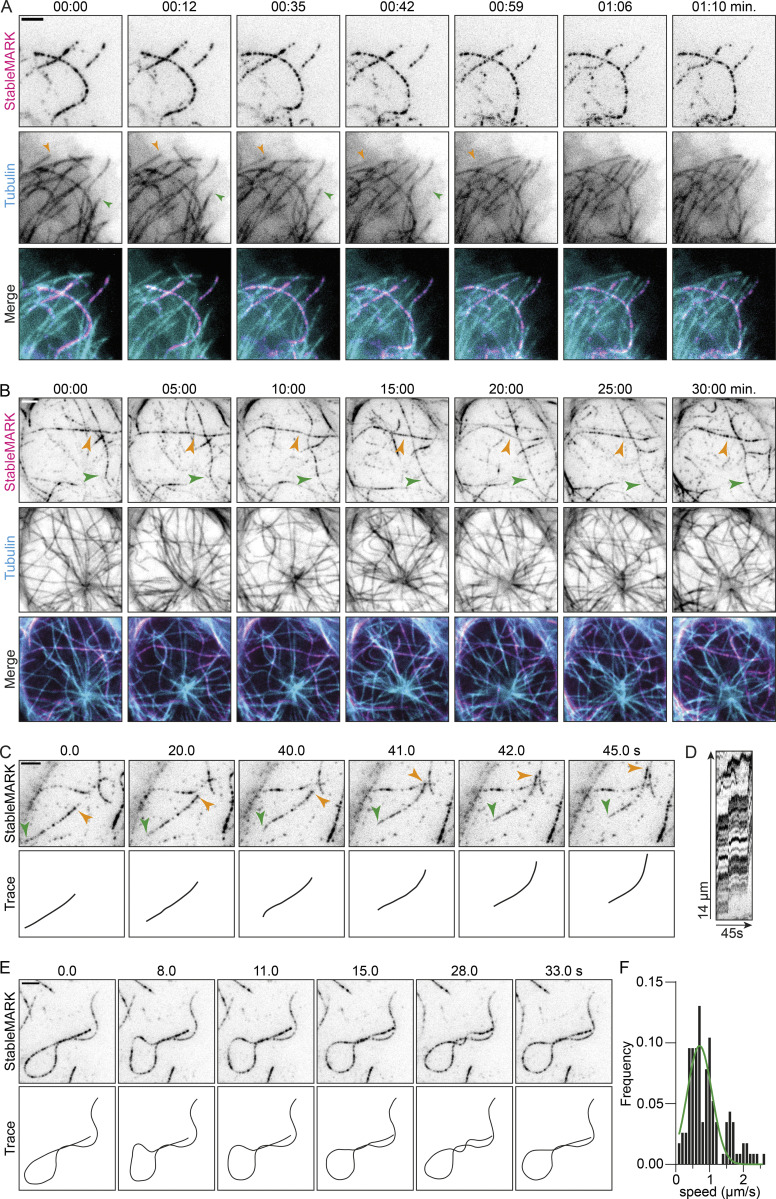
Figure 3.
StableMARK as a live-cell marker for stable MTs. (A and B) Stills from live-cell imaging of StableMARK and mCherry-tubulin on different time scales (see also Videos 2 and 3). Colored arrowheads in A show examples of MTs displaying dynamic instability. Colored arrowheads in B indicate StableMARK-decorated MTs that are retained during the duration of imaging. Time, min:s. (C and E) Stills and schematic representations from live-cell imaging of StableMARK in U2OS cells depicting MT sliding (indicated by colored arrowheads; see also Video 4) and MT looping (see also Video 5). Time, s:ms. (D) Kymograph of sliding event in C. (F) Histogram showing the speeds of StableMARK-MT movements (115 events from 42 cells from two independent experiments). The green line shows Gaussian fit with a mean of 0.7 µm/s. Scale bars, 2.5 µm.

