Figure 5.
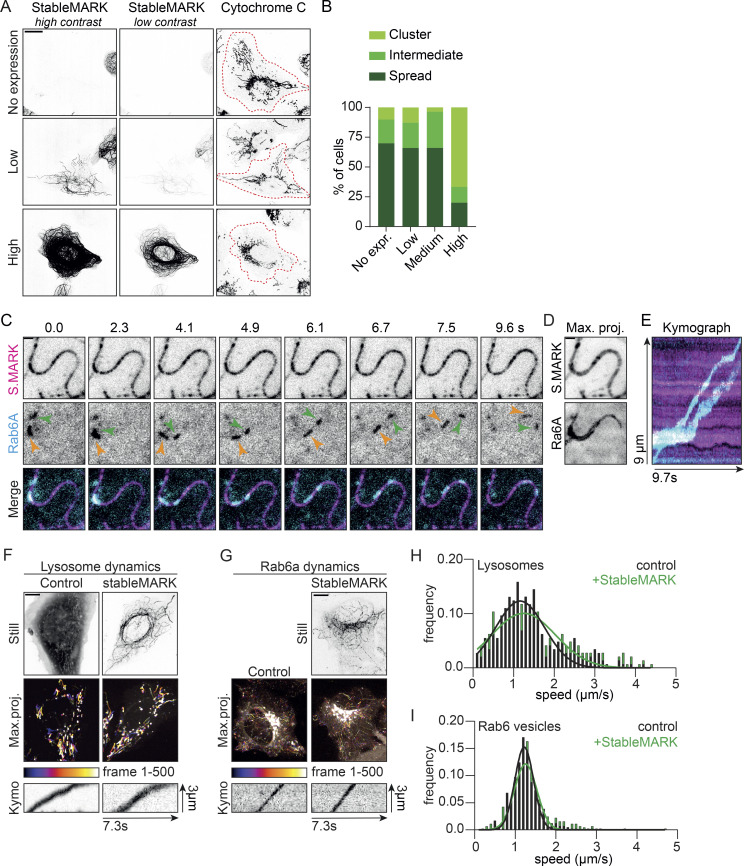
StableMARK at low expression levels has minimal effects on organelle transport. (A) Fluorescence images of U2OS cells stained for the mitochondrial marker cytochrome C at different levels of StableMARK expression. Cell outlines are indicated with red dashed lines. (B) Classification of mitochondria distribution at different levels of StableMARK expression (no expression, n = 166 cells; StableMARK expressing, n = 119 cells [low, n = 47 cells; medium, n = 56 cells; high, n = 15 cells]). Data from one experiment; independent duplicate in supplement (Fig. S4 D). (C) Stills from live-cell imaging of U2OS cells expressing StableMARK and mCherry-Rab6a (see also Video 6). (D) Maximum projection over time from the stream acquisition shown in C. (E) Kymograph showing Rab6a motility along the StableMARK-decorated MT shown in C. (F) Live-cell imaging of lysosomes using SiR-lysosome. Stills from GFP fill (control condition) and StableMARK are shown as well as color-coded maximum projections and illustrative kymographs of streams acquired from the SiR-lysosome channel. (G) Live-cell imaging of Rab6a-mCherry. Still of StableMARK is shown as well as color-coded maximum projections and illustrative kymographs of streams acquired from Rab6a channel. (H) Histogram showing the speed distribution of lysosomes in control cells and low-StableMARK-expressing cells (289–290 events from 14 to 16 cells per condition from two independent experiments). Black line (control condition) and green line (StableMARK condition) show Gaussian fit with a mean of 1.16 µm/s and 1.25 µm/s, respectively. (I) Histogram showing the speed distribution of Rab6 vesicles in control cells and low-StableMARK-expressing cells (410–447 events from 20 cells per condition from three independent experiments). Black line (control condition) and green line (StableMARK condition) show Gaussian fit with a mean of 1.22 and 1.26 µm/s, respectively. Scale bars, 20 µm (A), 10 µm (F and G), and 1 µm (C and D). Time, s:ms.

