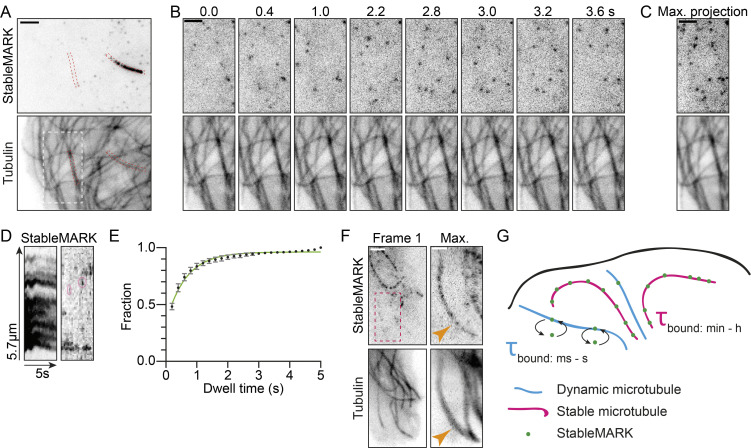
Figure 7.
Differential binding of StableMARK molecules to stable and dynamic MTs. (A) Live U2OS cell expressing StableMARK and mCherry-tubulin. (B) Stills from live-cell imaging of region indicated with a white dashed box in A (see also Video 9). (C) Maximum projection of 25 frames (5 s) of the region indicated with a white dashed box in A. (D) Kymographs of StableMARK channel of red dashed boxes in A. Pink ovals in the right kymograph indicate examples of short binding events of StableMARK to a dynamic MT. (E) Cumulative histogram ± SD of dwell time of StableMARK on dynamic MTs (5,006 events from 23 cells from three independent experiments). Green line shows fit with , yielding τ = 1/k = 0.65 s. (F) Live U2OS cell expressing StableMARK and mCherry-tubulin. Maximum projection of red dashed box represents 123 frames (122 s). Orange arrowheads point toward a dynamic MT with which StableMARK molecules have transiently interacted. (G) Cartoon: StableMARK molecules stably bind stable MTs (τbound: min—h), whereas StableMARK molecules interact transiently with dynamic MTs (τbound: ms—s). Scale bars, 2.5 µm (A), 1 µm (F-zoom), 2 µm (B, C, and F). Time, s:ms.

