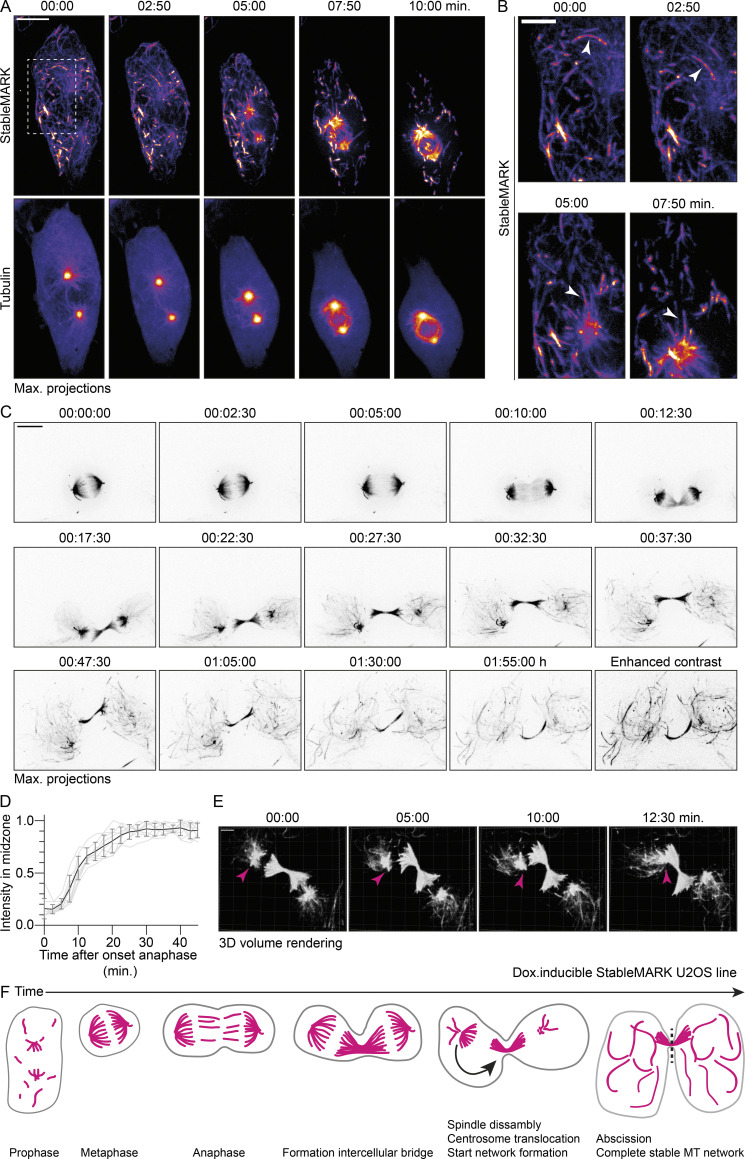
Figure 8.
Dynamics of stable MT before, during, and after cell division. (A) Stills from live-cell imaging of U2OS:StableMARK cells treated with doxycycline to induce expression and transiently transfected with mCherry-tubulin. For every time point, a maximum intensity projection of a Z-stack of 25 slices with 0.75 µm step size is shown. (B) Zooms of region indicated with white, dashed box in A. White arrowheads point toward a StableMARK-decorated MT that is transported toward the developing spindle. Time, min:s. (C) Stills from live-cell imaging of U2OS:StableMARK cell(s) treated with doxycycline to induce expression. For every time point, a maximum intensity projection of a Z-stack of 25 slices with 0.75 µm step size is shown. Last time point is also displayed with enhanced contrast. Time, h:min:s (see also Video 10). (D) Graph showing the change in normalized fluorescent intensity of StableMARK in the midzone over time. Events were aligned on the onset of anaphase, which was set to T = 0. Mean (black line) ± SD and individual trace (light gray) from nine cells from three independent experiments are shown. (E) Stills from live-cell imaging of U2OS:StableMARK cell(s) treated with doxycycline to induce expression. For every time point, a Z-stack of 25 slices with 0.75 µm step size is shown as a 3D volumetric render. Magenta arrowheads indicate translocation of spindle remnant toward the intercellular bridge. Time: min:s. (F) Cartoon illustrating the organization of the stable MT array from prophase until abscission of the intercellular bridge. Scale bars, 10 µm (A and C), 5 µm (B), 4 µm (E).

