Figure S1.
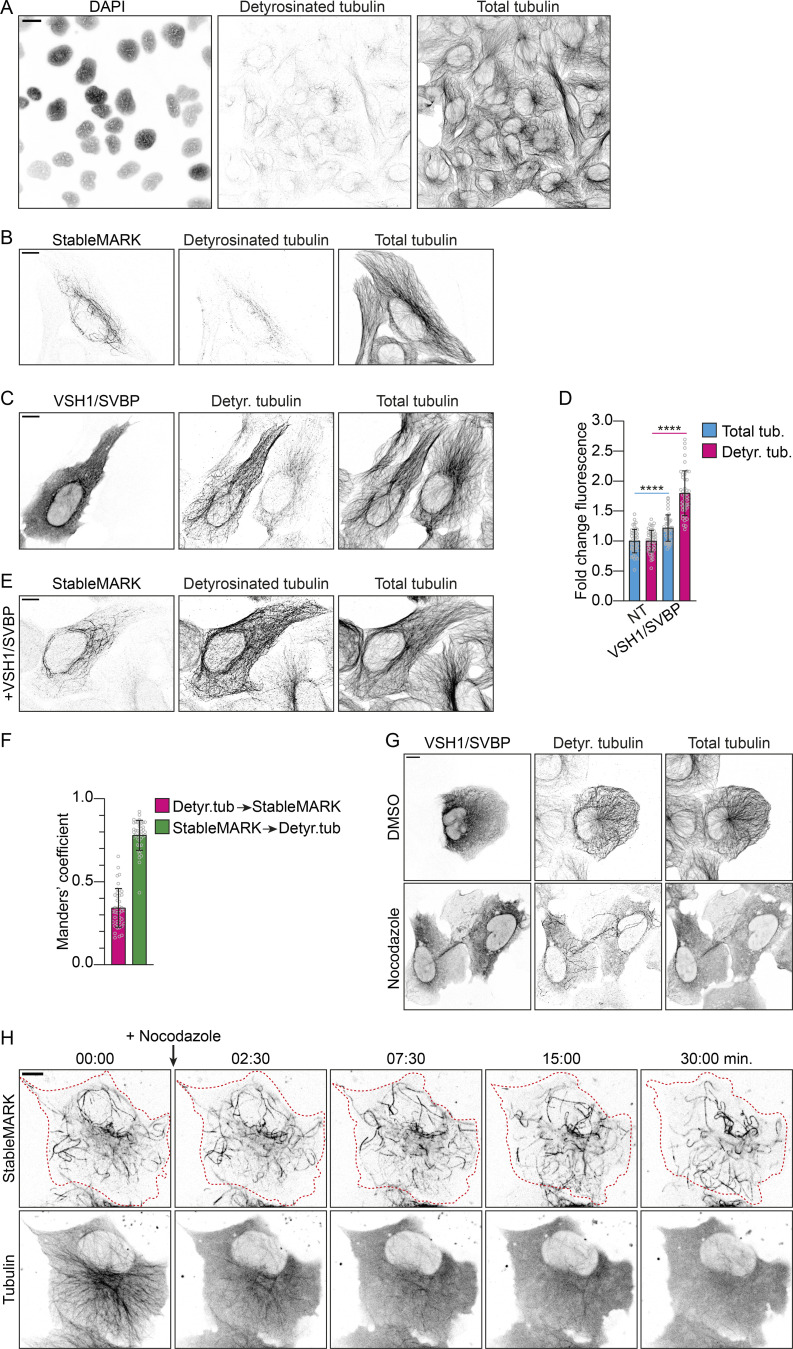
StableMARK labels the subset of stable MTs. Related to Figs. 1 and 2. (A) Fluorescence images of U2OS cells stained for DAPI and immunolabeled for detyrosinated tubulin and α-tubulin are shown in inverted contrast. (B) Fluorescence images of U2OS cell expressing StableMARK and immunolabeled for detyrosinated tubulin and α-tubulin. (C) U2OS cell expressing VSH1-GFP and SVBP-FLAG (left cell) and a non-transfected cells (right cell) immunolabeled for GFP, detyrosinated tubulin, and α-tubulin. (D) Bar graph showing the fold change in mean fluorescence intensity of total tubulin and detyrosinated tubulin of VSH1/SVBP expressing cells normalized to non-transfected control cells. Graph represents mean ± SD as well as individual values (gray circles) for 43–46 cells per condition from three independent experiments. Unpaired T test, ****P ≤ 0.0001. (E) Fluorescence images of U2OS cell expressing VSH1-FLAG, SBVP-FLAG, and StableMARK immunolabeled for detyrosinated tubulin and α-tubulin. (F) Bar graph showing thresholded Manders’ coefficients measured from 12.5 × 12.5 µm ROIs per cell for the condition described in E. Pink bar represents the colocalization coefficient for detyrosinated MTs to StableMARK-decorated MTs. Green bar represents the colocalization coefficient for StableMARK-decorated MTs to detyrosinated MTs. Graph represents mean ± SD as well as individual values (gray circles) for 41 cells per condition from three independent experiments. (G) Fluorescence images of U2OS cells expressing VSH1-GFP and SBVP-FLAG treated for 1 h with 0.1% DMSO or 10 µM nocodazole and immunolabelled for detyrosinated tubulin and α-tubulin. (H) Stills from live-cell imaging of StableMARK and mCherry-tubulin in U2OS cell upon addition of 10 µM nocodazole. Time: min:s. Scale bars, 20 µm (A), 10 µm (B, C, E, G, and H).

