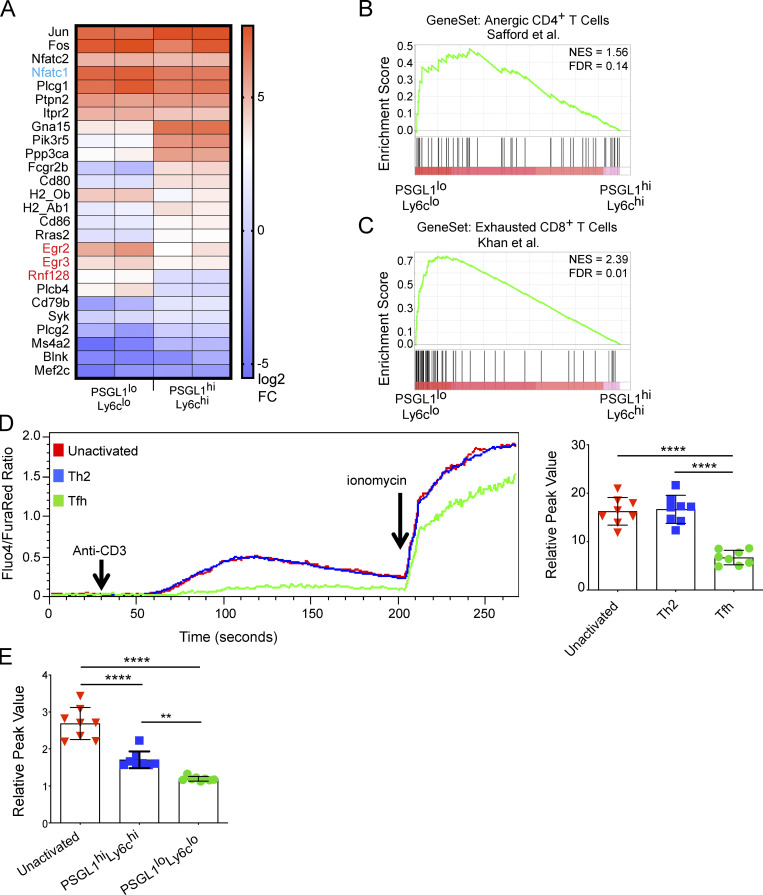
Figure 1.
Tfh cells are characterized by an AP-1–independent NFAT gene expression signature. (A) NFAT gene signature from RNA-Seq of PSGL1hiLy6chi and PSGL1loLy6clo CD4+ T cells (Ray et al., 2015). Nfatc1, the gene encoding NFAT2 is shown in blue. Egr2, Egr3, and Rnf128, canonical AP-1–independent NFAT gene transcripts, are highlighted in red. (B) GSEA of PSGL1hiLy6chi and PSGL1loLy6clo CD4+ T cells (Ray et al., 2015) using gene set from anergic CD4+ T cells (Safford et al., 2005). (C) GSEA using gene set derived from exhausted CD8+ T cells in mice chronically infected with LCMV (Khan et al., 2019). (D) TCR stimulation mediated in vitro calcium flux after papain/NP-ova immunization. CD4+ T cell populations were defined as unactivated (CD4+CD44lo), Th2 (CD4+CD44hiPD1−CXCR5−), or Tfh (CD4+CD44hiPD1+CXCR5+). The left panel shows a representative time course for one experiment. The Fluo4/FuraRed ratio is plotted over time and reports cytosolic calcium in response to the indicated agents. The right panel shows cumulative data for multiple samples and plots the relative calcium peak (calculated as a ratio of peak Fluo4/FuraRed value to mean baseline Fluo4/FuraRed value) for the different T cell subsets. (E) TCR stimulation mediated in vitro calcium flux after acute infection with LCMV. Data in D and E are representative of at least three independent experiments with three to five mice per experiment for D and five to 10 mice per experiment for E. One-way ANOVA with post-hoc Tukey’s test used for analysis of D and E. See also Fig. S1. **** = P ≤ 0.0001, ** = P ≤ 0.01. NES, normalized enrichment score; FDR, false discovery rate.

