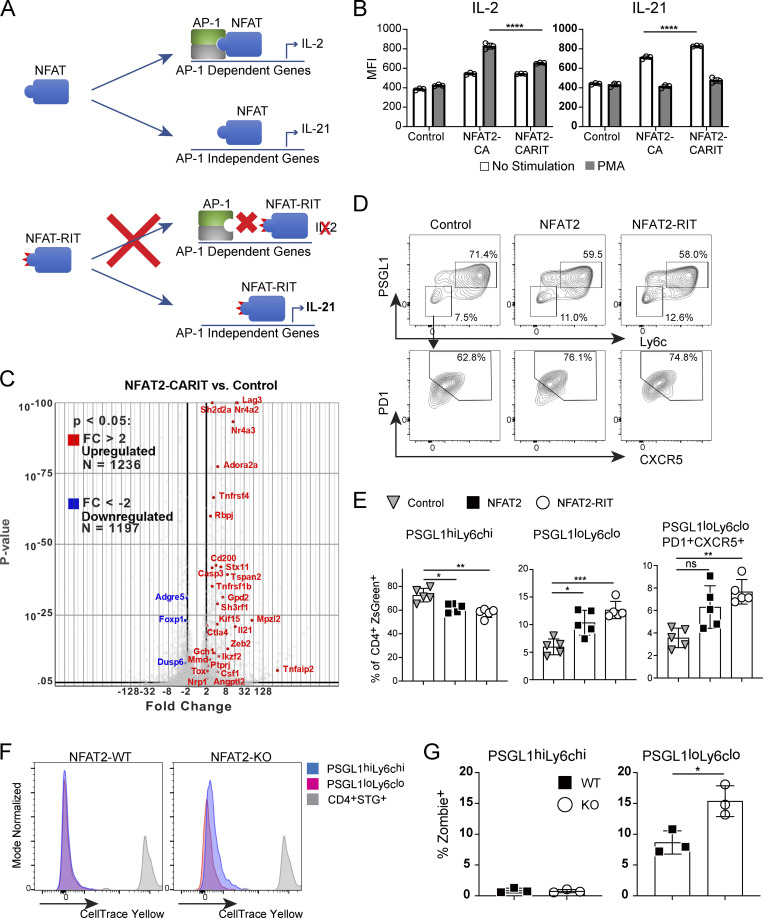
Figure 2.
AP-1–independent NFAT signaling is sufficient for Tfh cell development. (A) Schematic representation of WT NFAT and NFAT-RIT mutant proteins and their differential abilities to engage AP-1–dependent or AP-1–independent gene expression programs. (B) CD4+ T cells were transduced with pMIZ control, pMIZ-NFAT2, or pMIZ-NFAT2-CARIT retroviral vectors. After 72 h, cells were either incubated with fresh media or stimulated with PMA and then analyzed by flow cytometry for expression of ZsGreen (to mark transduced cells), IL-2, and IL-21. One-way ANOVA with post-hoc Tukey’s test used for analysis. Representative of three independent experiments. (C) Volcano plot of gene expression from RNA-Seq of CD4+ T cells transduced with control or NFAT2-CARIT. Selected anergy-associated genes (Martinez et al., 2015; Safford et al., 2005) have been annotated. (D) Representative flow plots of PSGL1hiLy6chi, PSGL1loLy6clo, and PSGL1loLyc6loPD1+CXCR5+ CD4+ T cell populations following acute LCMV Armstrong infection of mice receiving NFAT2-deficient STG+ T cells transduced with control, NFAT2, or NFAT2-RIT retroviral expression vectors. (E) Quantification of data from D. One-way ANOVA with post-hoc Tukey’s test used for analysis. (F) Flow cytometry measurement CellTrace Yellow cell proliferation dye in the indicated cell populations. (G) Viability of the indicated cell populations assessed by the Zombie cell death dye. Data are representative of at least three replicates and two independent experiments for D and E (at least five animals per group) and two independent experiments for G and H (three animals per group). See also Fig. S2. **** = P ≤ 0.0001, *** = P ≤ 0.001, ** = P ≤ 0.01, * = P ≤ 0.05, and ns P > 0.05.

