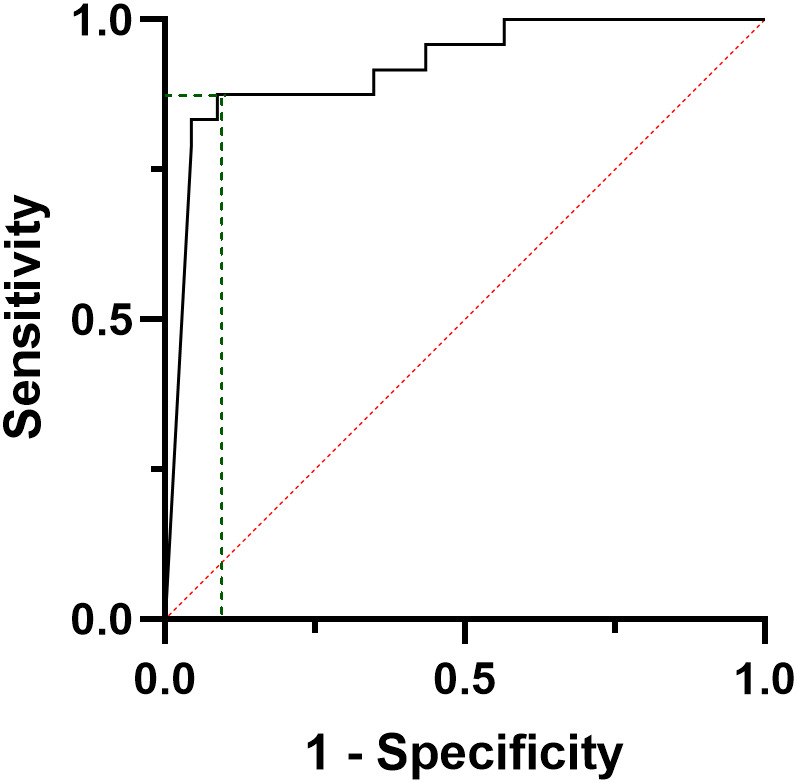
Figure 2.

ROC curve analysis considering the decreasing rate of calcitonin values from the baseline to the six months after surgery, according to the final disease status, i.e. complete response vs persistent disease.

ROC curve analysis considering the decreasing rate of calcitonin values from the baseline to the six months after surgery, according to the final disease status, i.e. complete response vs persistent disease.