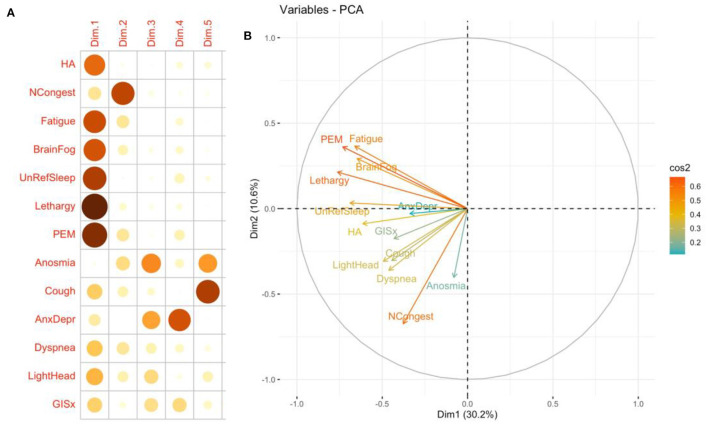
Figure 3.
Quality of representation of 13 most common symptoms mapped to the first five dimensions (A) and principal components analysis correlation circle (B). Insomnia and ageusia were not included in the analysis. The closer the variable to the correlation circle, the better the representation on the factor map. The quality of the representation of the symptom on the first five dimensions is measured by the squared cosine between the symptom vector and its projection on the dimension. The proportions on the left side of the factor map represent a color scale (14). CP, Chest pain; GISx, Gastrointestinal symptoms; Anex/Depr, Anxiety/Depression; HA, Headache; Lethargy, daytime sleepiness; UnRefrSleep, Unrefreshed sleep; PEM, Post-Exertional Malaise.

