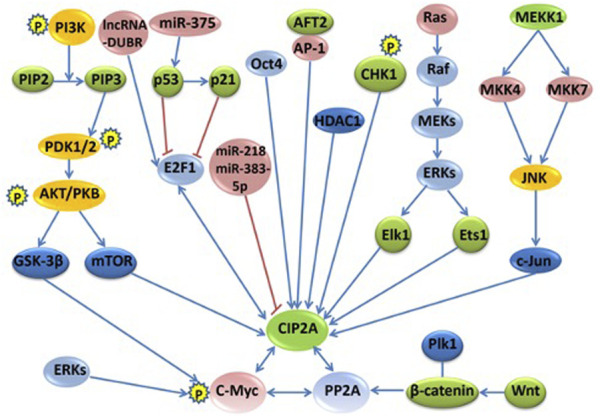
FIGURE 1.

The signaling pathways and regulation networks of CIP2A/p90. Several signaling pathways, including the PI3K–AKT–mTOR pathway, the RAS–MEK–ERK pathway, the Wnt–β-catenin pathway, the MKK4/MKK7-JNK-c-Jun pathway, the p53-p21-E2F1-CIP2A/p90 pathway, and the phosphorylation and degradation of c-Myc, non-coding RNAs, and other regulation factors, such as Oct4, AFT2, CHK1, and HDAC1, are included in this figure. Bidirectional blue arrows indicate interactions between two entities; unidirectional blue arrows indicate a positive influence of an entity on another; red lines indicate a negative influence of one entity on another.
