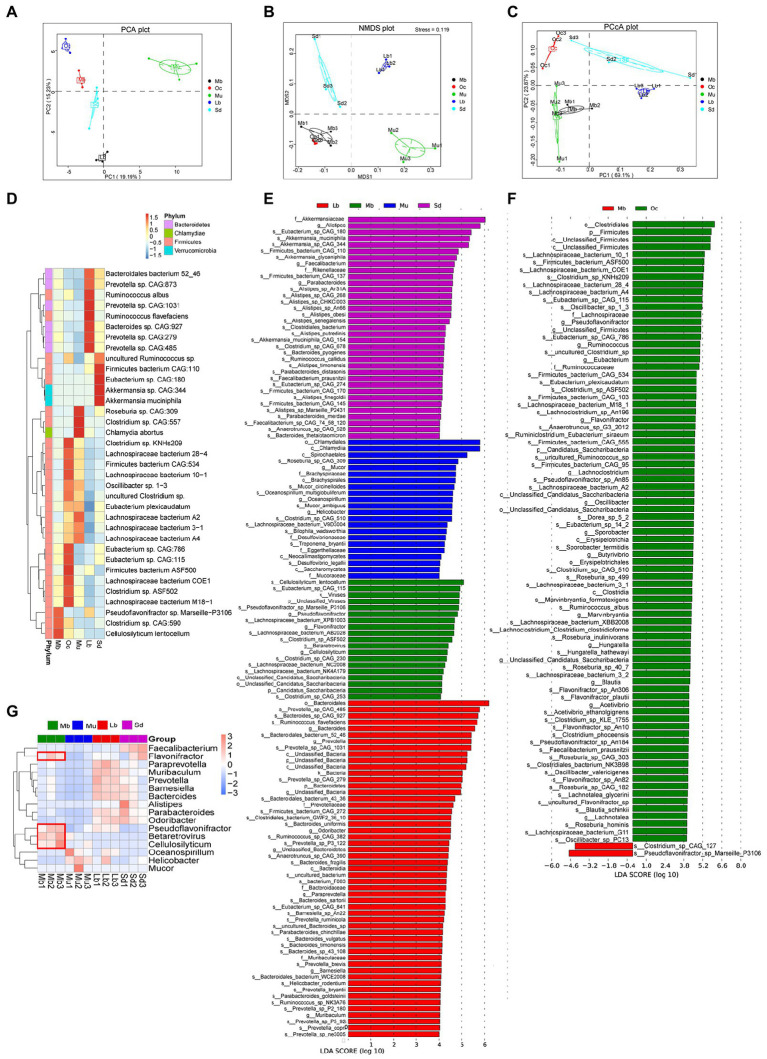
Figure 3.
Analysis of gut microbiota with significant differences. (A) PCA analysis among the Mb, Oc, Mu, Lb, and Sd groups under phyla level. The horizontal coordinates indicate one principal component, vertical coordinates indicate the second principal component, percentages indicate the contribution of the principal component to sample variation, each point in the figure represents a sample, and the samples are represented by the same color. (B) NMDS analysis among the Mb, Oc, Mu, Lb, and Sd groups under phyla level (Stress = 0.119). Each point in the graph represents a sample, and the distance between points represents the degree of difference. When the Stress is less than 0.2, it indicates that the NMDS analysis has certain reliability. (C) PCoA analysis among the Mb, Oc, Mu, Lb, and Sd groups under phyla level The horizontal coordinate indicates one principal component, the vertical coordinate indicates another principal component, and the percentage indicates the contribution of the principal component to the variance of the samples. (D) Relative abundances of bacterial species among the Mb, Oc, Mu, Lb, and Sd groups. (E) The featured microbial taxa of each animal species according to the results of LEfSe differential analysis. The bar chart of the distribution of LDA score shows microbial taxa with an LDA Score greater than a set value (LDA score > 4.0), i.e., Biomarkers that are statistically different between the Mb, Mu, Lb, and Sd groups, and the length of the bar chart represents the size of the effect of the differential species. (F) The featured microbial taxa of each animal species according to the results of LEfSe differential analysis. The differential analysis was conducted between the Mb and Oc groups (LDA score > 4.0). (G) Relative abundances of bacterial taxa (Biomarker with statistical differences) varied across the Mb, Mu, Lb, and Sd samples according to the results of LEfSe (LDA score > 4.0).

