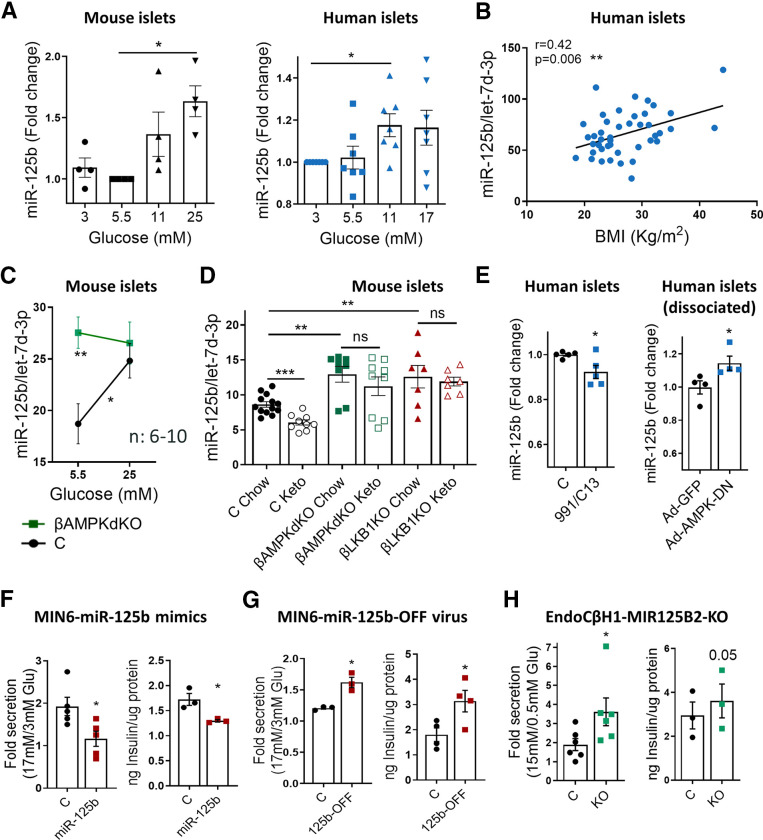
Figure 1.
MiR-125b expression is stimulated by glucose via AMPK repression in islets and regulates insulin secretion in insulinoma/β-cell lines. A–E: Quantitative RT-PCR measurements of MiR-125b in (A) mouse and human islets cultured at the indicated glucose concentrations for 48 h; (B) human islets (from nondiabetic donors) kept for 24 h at 5.5 mM glucose plotted against donor’s BMI; (C) islets from βAMPKdKO (green) and control (C; black) mice cultured at 5.5 or 25 mM glucose for 48 h; (D) islets from βAMPKdKO (green), βLKB1KO (red), and control (black) male and female mice fed a chow or a ketogenic (Keto) diet for 28 days; and (E) human islets treated with the AMPK activators 13C (50 nM) and C-991 (20 nM) for 16 h (left) and dissociated human islets infected with adenovirus expressing a dominant-negative AMPK protein (Ad-AMPK-DN) or empty control (Ad-GFP) at a multiplicity of infection (MOI) of 5 for 48 h (right). Each dot represents islets from a single mouse or human donor. MiR-125b expression is normalized to that of the endogenous control let-7d-3p (4). F–H: GSIS (left panels) and insulin content (right panels). GSIS was quantified after 30 min of 17 or 15 mmol/L glucose stimulation following overnight preincubation at 3 mmol/L glucose of MIN6 (F, G) and EndoCβ-H1 with CRISPR-mediated miR-125b knockout (KO) (H). MIN6 cells were transfected with 5 nM miR-125b (125b) or control mimics (F) or infected with adenovirus expressing a miR-125b inhibitor (125b-OFF) or a nontargeting control at a MOI of 10 (G) 48 h before the experiments. Intracellular protein content was quantified by bicinchoninic acid assay to calculate insulin content per microgram of total protein. Data are presented as fold change of basal level. Each dot represents an independent experiment with two to three technical replicates. Experiments were performed with three different populations of CRISPR-mediated miR-125b KO and control cells. Error bars represent SEM. *P < 0.05, **P < 0.01, ***P < 0.001, one-way ANOVA (repeated measures) and Dunnet multiple comparisons test (A), Pearson correlation adjusted by age and sex (B), two-way ANOVA (repeated measures) and Bonferroni multiple comparisons test (C), unpaired Welch (D) and paired Student (E–H) t test. ns, not significant.

