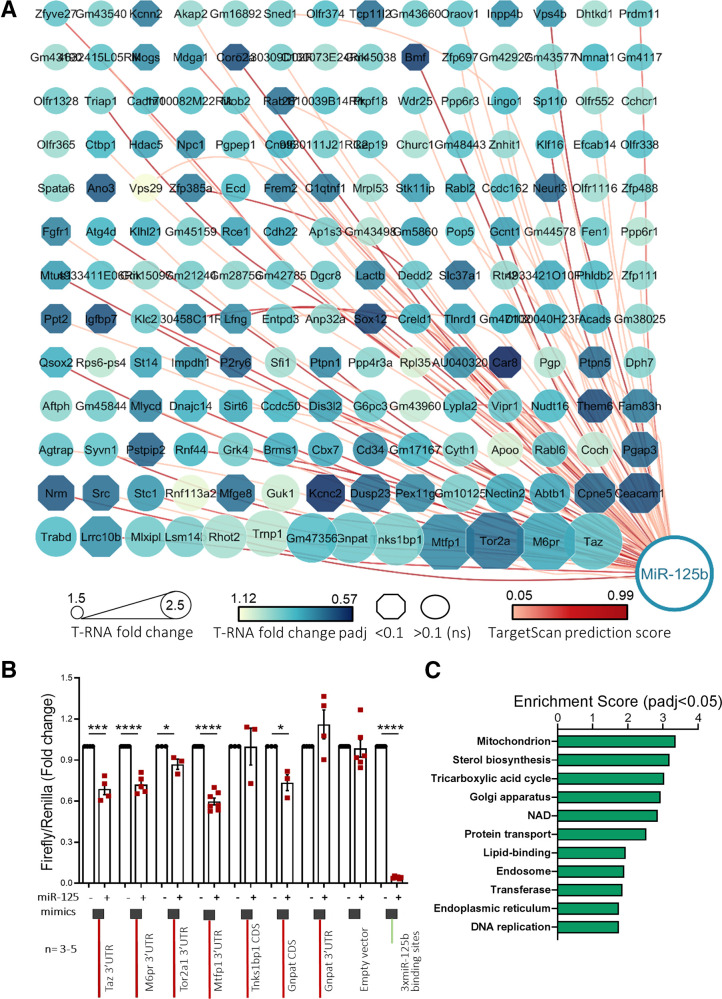
Figure 2.
High-through identification and validation of miR-125b target genes. MIN6 cells were transfected with 5 nM control or miR-125b mimics. A: Cytoscape-generated (49) layout of genes with RIP-RNA to T-RNA ratio > 1.5 upon miR-125b overexpression (arbitrary cutoff) in MIN6 cells were transfected with 5 nM control or miR-125b mimics. Node size represents the extent of the RIP-RNA to T-RNA ratio (the larger, the higher). The intensity of the gene node color indicates the fold downregulation of each gene upon miR-125b expression (T-RNA). Downregulation at the transcript level was statistically significant for those genes represented in an octagonal shape. Lines connecting the nodes or genes with miR-125b indicate the presence of a predicted binding site for miR-125b as identified by TargetScan, with the intensity in the color of the line representing the score (total context score). B: Validation of miR-125b binding to the regions (full-length CDS or 3′UTR, as indicated) containing predicted miR-125b binding sites of six identified targets with highest RIP-RNA to T-RNA ratio. Luciferase reporter assay of MIN6 cells cotransfected with pmirGLO plasmids containing the indicated target downstream the luciferase open reading frame and miR-125b (+) or nontargeting (−) control mimics. Samples were measured 24 h after transfection in technical replicates. Firefly luciferase values are normalized to Renilla, independently expressed by the same vector, and are shown as relative to that obtained for each construct cotransfected with the control miRNA mimic. Each dot represents an independent experiment. A construct containing three perfectly complementary binding sites for miR-125b (positive control) and the empty pmiRGlo vector (negative control) were included in the experiments. C: GO enrichment analysis of the genes significantly up- and downregulated upon miR-125b overexpression (T-RNA) and putative miR-125b direct targets (RIP-RNA to T-RNA ratio > 1.5) performed with the Database for Annotation, Visualization and Integrated Discovery. The graph shows enrichment scores for one representative term for each cluster grouped by semantic similarities and including terms with a Padj (Benjamini) < 0.05. See Supplementary Table 2 for a full list of terms. Error bars represent SEM. *P < 0.05, ***P < 0.001, ****P < 0.0001, paired Student t test values of the log(fold change) values.

